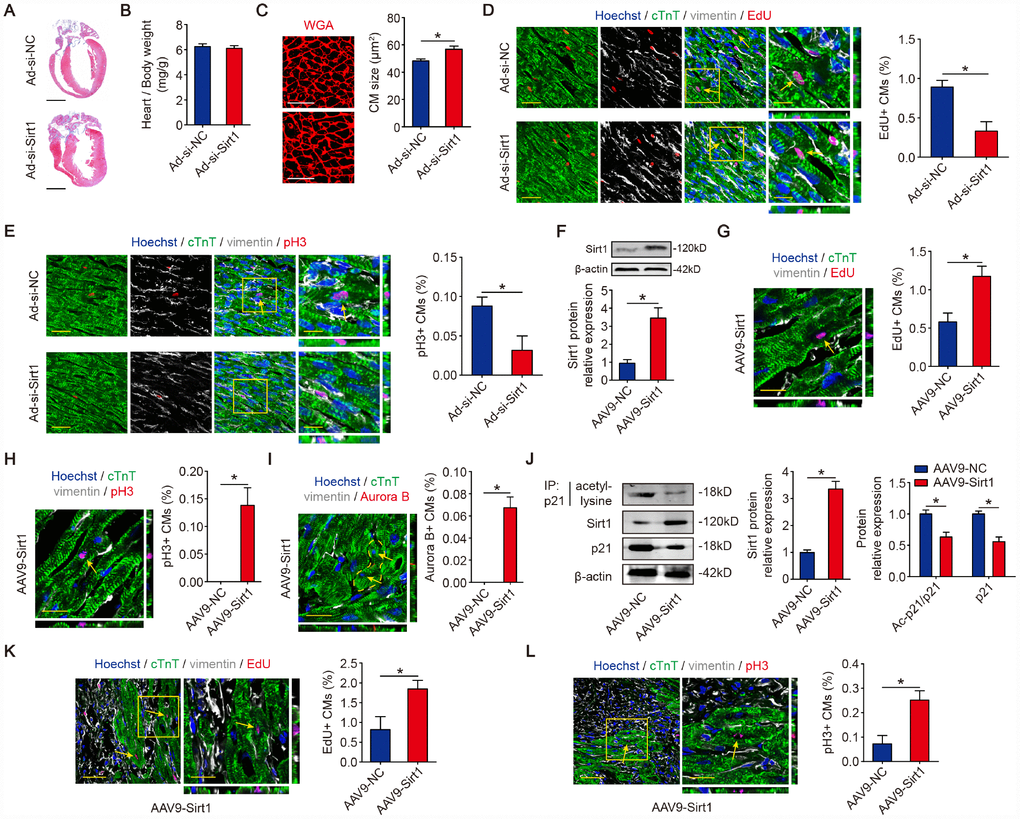
Figure 5.Sirt1 drives CM proliferation in vivo. (A) Masson staining of sagittal heart sections from neonatal mice injected with Ad-si-NC or Ad-si-Sirt1, Scale bar, 1mm. (B) Ratios of heart weight-to-body weight in neonatal mouse hearts injected with Ad-si-NC or Ad-si-Sirt1 (n=5). (C) WGA staining of sagittal heart sections in the Ad-si-NC and Ad-si-Sirt1 groups at P10. Quantitative analyses are representative of fields from 5 mice per group, Scale bar, 50μm. (D) Immunofluorescence for EdU and quantification of EdU-positive CMs in neonatal hearts injected with Ad-si-NC or Ad-si-Sirt1 (n=5). The arrows indicate EdU-positive CM nuclei. Scale bar, left, 50 μm, right, 20 μm. (E) Immunofluorescence for pH3 and quantification of pH3-positive CMs in neonatal hearts injected with Ad-si-NC or Ad-si-Sirt1 (n=5). The arrow indicates pH3-positive CM nuclei. Scale bar, left, 50 μm, right, 20 μm. (F) Western blotting analyses of Sirt1 levels in adeno-associated virus 9-negative control (AAV9-NC) or adeno-associated virus 9-Sirt1 (AAV9-Sirt1) injected adult mouse hearts 28 days after injection. β-actin was used as a loading control (n=5). (G) DNA synthesis was assessed using EdU immunofluorescence staining and EdU-positive CMs were quantified in AAV9-NC and AAV9-Sirt1 adult mouse hearts. The arrow indicates EdU-positive CM nuclei. Scale bar, 20μm. Quantitative analyses are representative of fields from 5 mice per group. (H) Mitosis was detected using pH3 immunofluorescence staining and pH3-positive CMs are quantified in AAV9-NC and AAV9-Sirt1 adult mouse hearts. The arrow indicates pH3-positive CM nuclei. Scale bar, 20μm. Quantitative analyses are representative of fields from 5 mice per group. (I) Cytokinesis was detected using Aurora B immunofluorescence staining and Aurora B-positive CMs were quantified in AAV9-NC and AAV9-Sirt1 adult mouse hearts. The dotted lines indicate the daughter cells and the arrows indicate their nuclei. Scale bar, 20μm. Quantitative analyses are representative of fields from 5 mice per group. (J) 8-week-old MI mouse hearts were injected with AAV9-NC or AAV9-Sirt1. Heart lysates were immunoprecipitated with a p21 antibody and analyzed by Western blotting using an acetyl-lysine antibody; Western blotting was performed to evaluate Sirt1 and p21 protein expression in AAV9-NC or AAV9-Sirt1 adult heart lysates (n=5). (K) DNA synthesis was assessed using EdU immunofluorescence staining and quantification of EdU-positive CMs in AAV9-NC and AAV9-Sirt1 adult mouse hearts 28 days after MI. The arrows indicate EdU-positive CM nuclei. Scale bar, 20μm. Quantitative analyses are representative of fields from 5 mice per group. (L) Mitosis was detected using pH3 immunofluorescence staining and pH3-positive CMs were quantified in AAV9-NC and AAV9-Sirt1 adult mouse hearts 28 days after MI. The arrows indicate pH3-positive CM nuclei. Scale bar, 20μm. Quantitative analyses are representative of multiple fields from 5 mice per group. Statistical significance was calculated using a two-tailed unpaired Student’s t-test in A-L. *p<0.05; data are presented as the mean ± S.E.M.