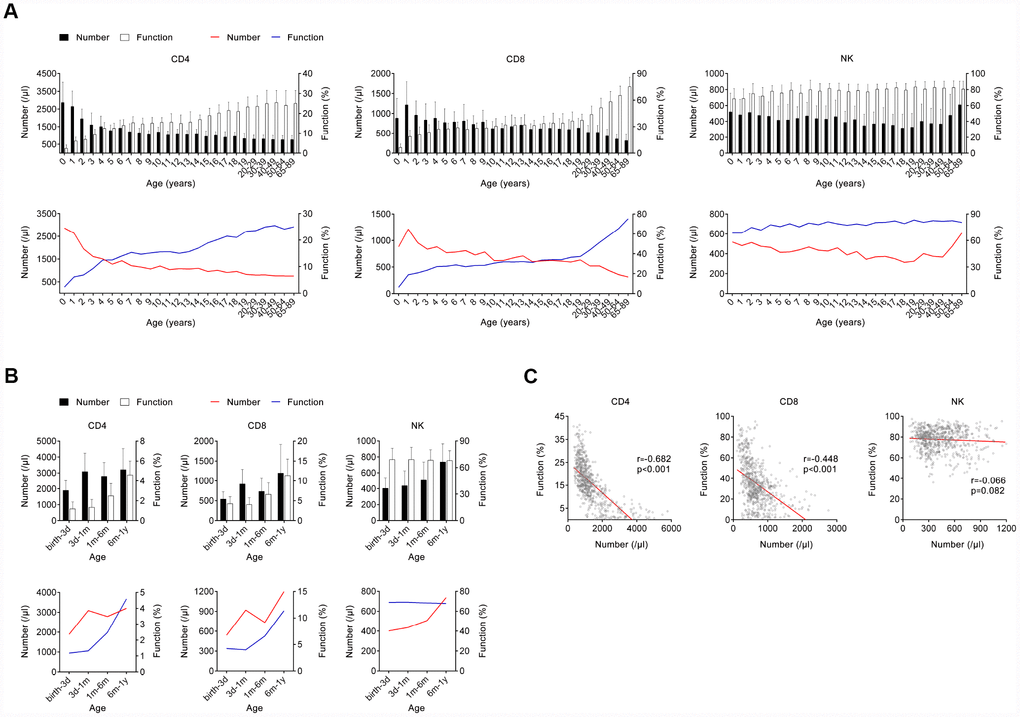
Figure 2.The number and function of lymphocytes in different age stages of healthy individuals. (A) Bar graphs showing the number and function of CD4+, CD8+ T cells, and NK cells in healthy individuals at different ages (between 0 and 89 years). Data are shown as means ± SD. Line diagrams showing the mean values of number and function of CD4+, CD8+ T cells, or NK cells at different ages (between 0 and 89 years). (B) Bar graphs showing the number and function of CD4+, CD8+ T cells, and NK cells in infants at different ages (between birth and 12 months). Data are shown as means ± SD. Line diagrams showing the mean values of number and function of CD4+, CD8+ T cells, or NK cells at different ages (between birth and 12 months). (C) Correlation between the number and function of CD4+, CD8+ T cells, and NK cells in all participants. Each symbol represents an individual donor.