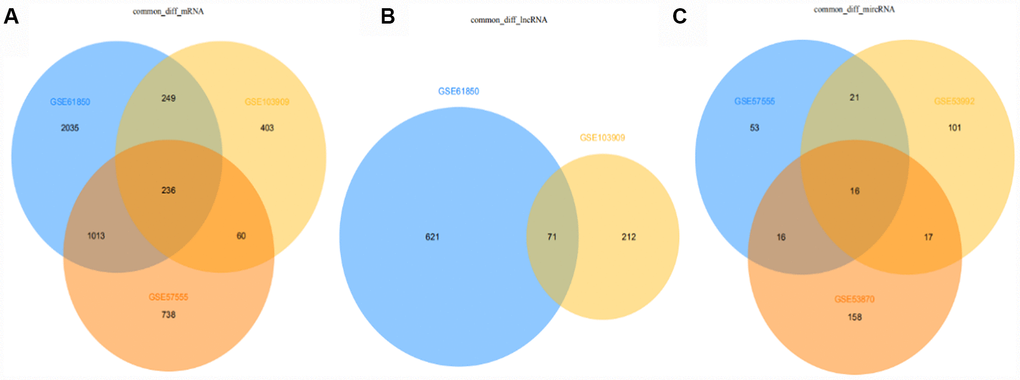
Figure 9.Venn diagram of differentially expressed mRNAs, lncRNAs, miRNAs in all datasets (from A to B to C: mRNA, lncRNA, miRNA).
Figure 9 — CeRNA regulatory network-based analysis to study the roles of noncoding RNAs in the pathogenesis of intrahepatic cholangiocellular carcinoma | Aging