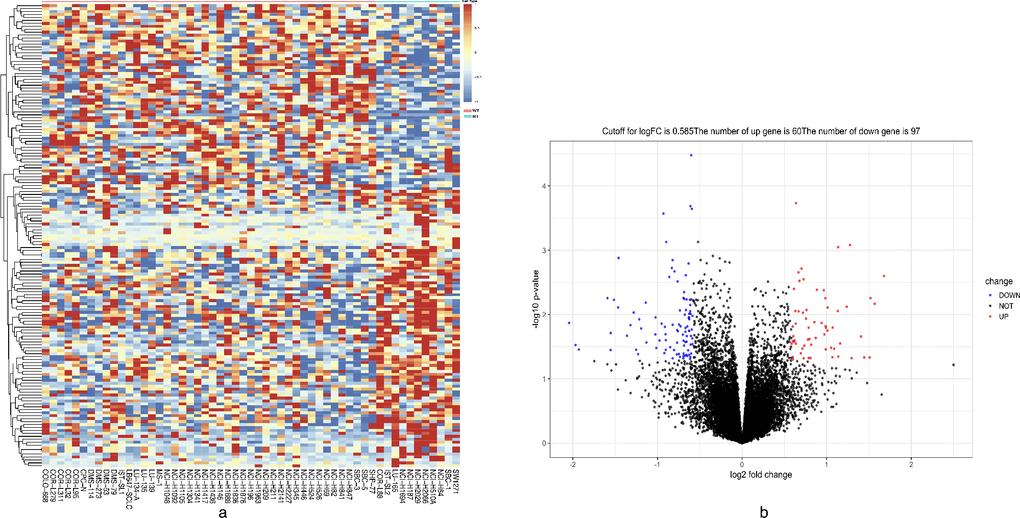
Figure 5.Heatmap and volcano plot showing DEGs. (A) Heatmap of the all 157 DEGs between DNAH10-mutated and wild-type DNAH10 SCLC cell lines [60 upregulated genes (red) and 97 downregulated genes (blue)]. (B) Volcano plot of differentially expressed mRNAs between DNAH10-mutated and wild-type DNAH10 SCLC cell lines. Red indicates high expression, and green indicates low expression (|FC| >1.5 and P <0.05). DEGs were calculated using the limma package in R software (Version.3.6). Sixty highly expressed DEGs and 97 low expressed ones. The volcano plot was conducted by the ggplot2 package of R language. DEGs: differentially expressed genes; FC: fold change; SCLC: Small Cell Lung Cancer.