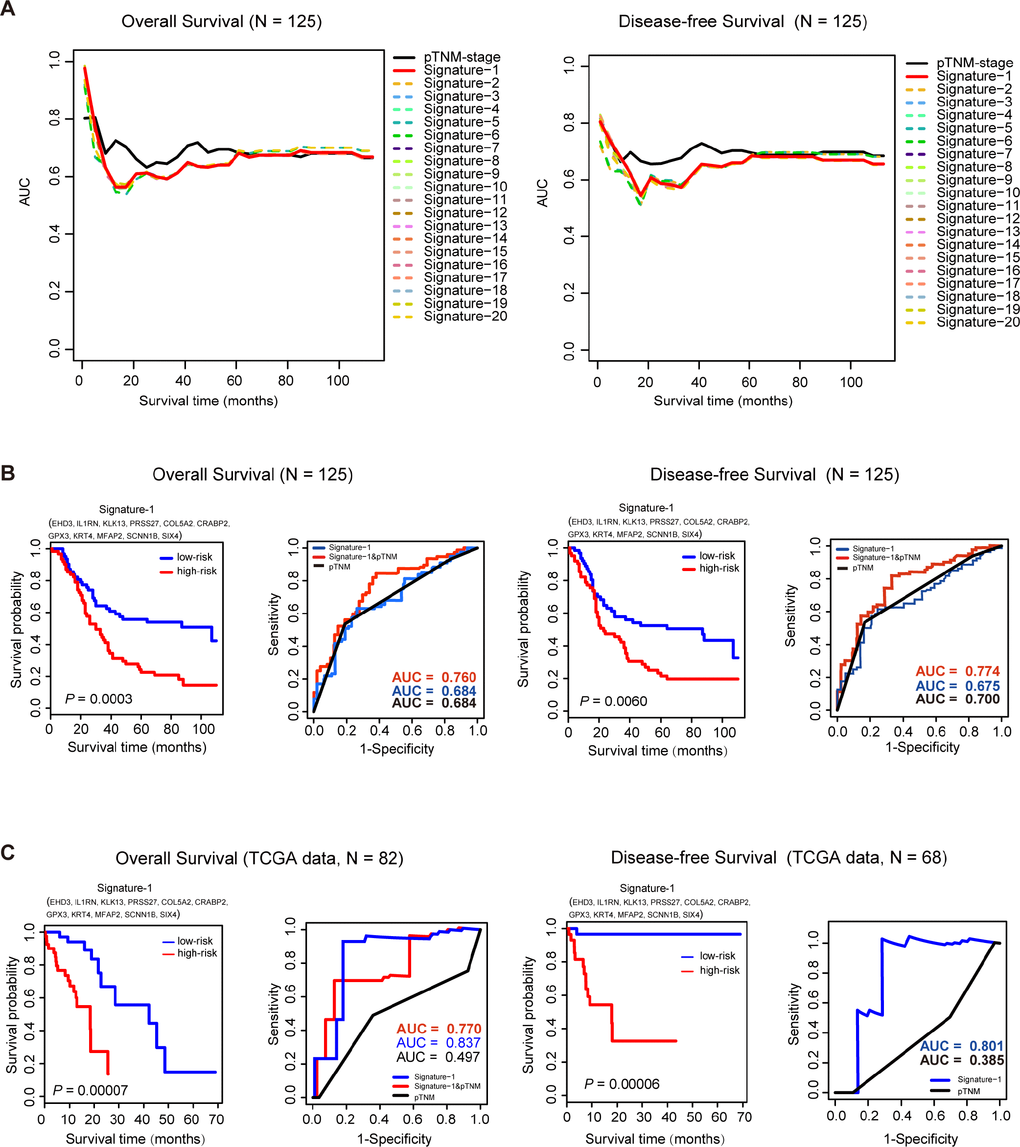
Figure 4.Survival analysis of 125 ESCC samples and TCGA data sets. (A), Time-dependent AUC curves of overall survival (OS) and disease-free survival (DFS) for the top 20 signatures in 125 ESCC samples. (B) For the 125 ESCC samples, Kaplan-Meier curves for overall survival (OS) and disease-free survival (DFS) for Signature-1. ROC analysis shows a better prognostic efficiency of Signature-1 combined with pTNM-stage compared with Signature-1 or pTNM-stage. (C) In the TCGA dataset, Kaplan-Meier curves of overall survival (OS) and disease-free survival (DFS)for Signature-1. ROC analysis shows better prognostic efficiency of Signature-1 compared with Signature-1 combined with pTNM-stage or pTNM-stage alone.