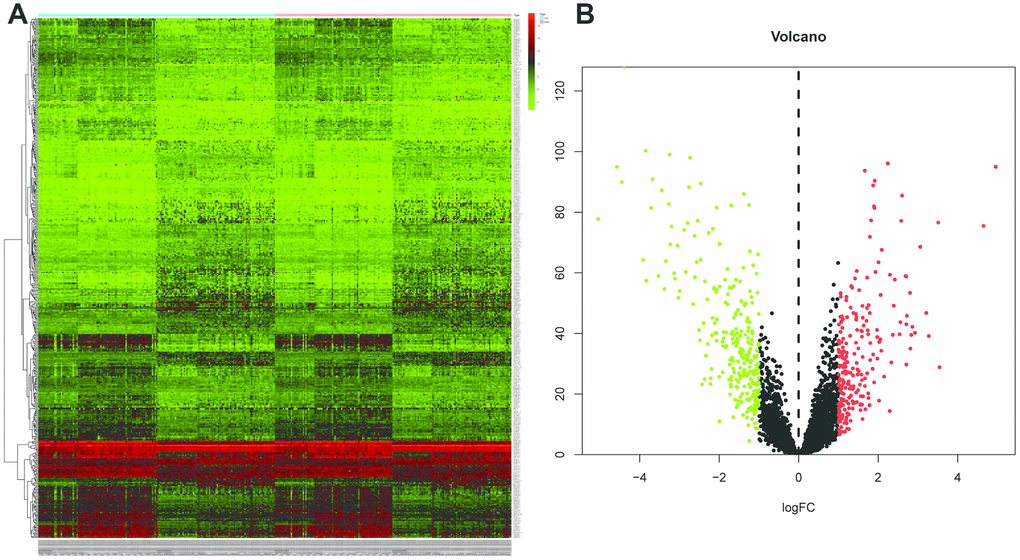
Figure 1.Identification of differentially expressed lincRNAs (DELs) by using “edgeR” and “DEseq” R package. (A) The heatmap of the DELs in ESCC when compared with normal tissue. (B) Volcano plot shown the expression change in ESCC when compared with normal tissue. An absolute log2 fold change (FC) > 1 and an adjusted P value of < 0.05 cutoff was used to defined DELs.