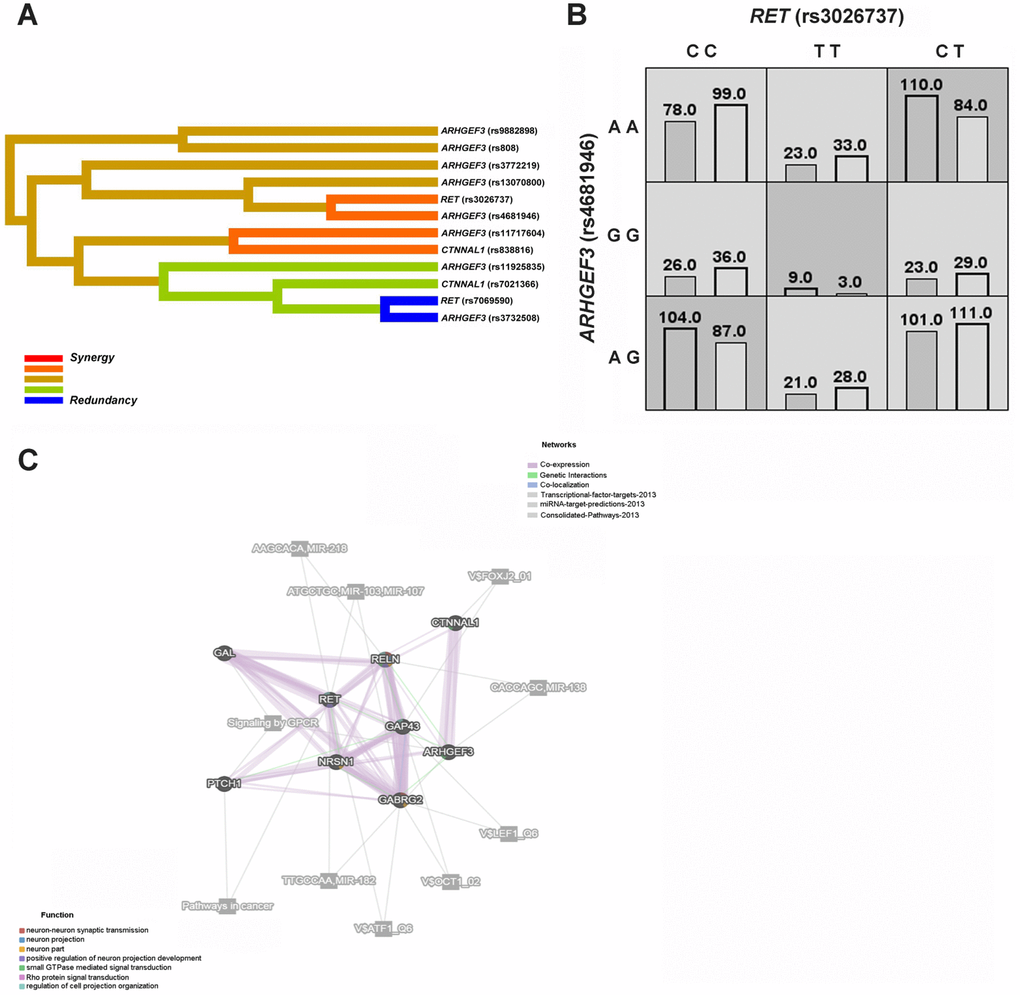
Figure 2.HSCR-related genetic interaction networks among RET, ARHGEF3, CTNNAL1 and our previously studied GAL, GAP43, NRSN1, PTCH1, GABRG2 and RELN gene. (A) The interaction dendrogram derived from MDR (Multifactor dimensionality reduction). Short connections among nodes represent stronger synergistic (red and orange) or redundant (green and blue) interactions. (B) In the two-factor best model, multilocus genotype combinations are linked to the altered HSCR risk. Darker-shaded cells represent higher risk combinations compared with lighter-shaded cells. Each cell denotes counts of HSCR subjects on left and controls on right. (C) The genetic interaction networks derived from GeneMANIA. The 9 HSCR-associated genes are linked to each other by the functional association networks in the GeneMANIA system.