


Introduction
Hirschsprung disease (HSCR, MIM 142623), as a life-threatening genetic disorder, affects approximately 1/5000 live births around the world (2.8/10000 newborns in Asian population), which makes it the most frequent congenital disease of intestinal motility [1]. HSCR is a functional intestinal obstruction characterized by congenital absence of enteric neurons along a variable length of the bowel, and accordingly, it can be anatomically classified as short segment HSCR (S-HSCR), long segment HSCR (L-HSCR) and total colonic aganglionosis (TCA), and approximately 80% of HSCR cases belong to S-HSCR [2]. Of note, Hirschsprung disease has also been identified in elderly patients, including a 70-year-old male and a 67-year-old female [3, 4]. Additionally, gastrointestinal abnormalities were observed in patients with Parkinson's disease (PD) over 30 years ago, indicating that the enteric nervous system (ENS) might be involved in PD, and mouse models of PD pathogenesis also show varying degrees of enteric neuronal dysfunction [5].
The major causes of Hirschsprung disease can be attributed to genetic factors or gene-gene interaction networks, since HSCR presents crucial features of multifactorial genetic models, such as low sex-dependent penetrance, high sibling recurrence risk, high heritability and interfamilial variation [6]. Approximately 80% of HSCR cases are sporadic, and the rest are familial; moreover, HSCR is associated with other congenital malformations in approximately 30% of cases [1, 7]. Resembling other complex diseases, a single homozygous null mutation of HSCR susceptibility genes is not sufficient to lead to a serious aganglionosis phenotype in HSCR [8]. To date, genetic studies have revealed that at least 15 genes might be involved in HSCR development, yet these genes account for only ~ 30% of all HSCR cases [9], implying the involvement of more genes in HSCR susceptibility. Whole exome sequencing study has revealed some novel HSCR genes, including DENND3, NCLN, NUP98 and TBATA, all of which might play a role in neuronal development [10]. More recently, new loci have been uncovered to be associated with Hirschsprung disease, such as ALDH1A2, PLD1, CASQ2 and CCT2 [11–13].
RET (ret proto-oncogene, located on chromosome 10q11.2), the major gene in HSCR, accounts for more than 80% of all known mutations [10, 14]. A recent genome-wide association study has revealed the key role of non-coding RET variants in HSCR [15]. Moreover, it has been indicated that in most HSCR cases, individuals with non-coding RET mutations also carry modifier loci, which contribute to HSCR presentation and phenotype severity, suggesting the potential interactions between RET and other genes involved in HSCR pathogenesis [16]. Taking advantage of the microarray technique and mouse model, Heanue et al. have demonstrated that both Arhgef3 (Rho guanine nucleotide exchange factor (GEF) 3) and Ctnnal1 (catenin (cadherin associated protein), alpha-like 1) have human homologues that map to previously identified HSCR susceptibility loci, i.e. the RET-dependent susceptibility loci (3p21 and 9q31), which makes them excellent candidate genes for Hirschsprung disease [17–19]. In addition, we wondered whether the interactions between RET, ARHGEF3 and CTNNAL1 contribute to the altered risk of HSCR since the joint gene-gene effects may have a significant impact on HSCR development [20]. It has recently been demonstrated that the interaction between RET and PHOX2B polymorphisms substantially affects the risk of Hirschsprung disease, suggesting that HSCR, as a multifactorial genetic disorder, requires the interactions of multiple unlinked genes to produce the phenotype [20]. In a recent study, we have shown that genetic markers within GAL, GAP43 and NRSN1 contribute to the altered HSCR susceptibility, and importantly, the interaction networks among GAP43, NRSN1 and PTCH1 confer an increased risk to Hirschsprung disease [21].
With all these lines of evidence, we tried to determine whether genetic variants of RET, ARHGEF3 and CTNNAL1 have an impact on the risk of Hirschsprung disease, and by recruiting 1015 subjects and 38 polymorphisms within these three genes, we further explored the potential interaction networks among RET, ARHGEF3, and CTNNAL1 and our previously studied GAL, GAP43, NRSN1, PTCH1, GABRG2 and RELN genes.
Results
Allele and genotype distributions of the genetic variants in RET, ARHGEF3, and CTNNAL1
In the 1015 subjects, genotype distributions of all 38 polymorphisms showed no significant deviations from Hardy-Weinberg equilibrium in either HSCR cases or normal controls (P> 0.05). The allele and genotype frequencies of the 38 SNPs are listed in Tables 1–3. We found that there were significant associations between HSCR and 20 genetic variants, including 13 RET SNPs, 3 ARHGEF3 SNPs, and 4 CTNNAL1 SNPs. Of note, all 13 positive SNPs in RET survived the FDR correction in terms of both allele and genotype distributions (Table 1), and the findings observed in genotype distributions of ARHGEF3 rs3732508 and in allele distributions of the 3 ARHGEF3 SNPs and the 4 CTNNAL1 SNPs remained significant after the FDR correction (Tables 2, 3). In addition, compared with previous findings regarding the 4 RET variants (rs2506030, rs7069590, rs2505998 and rs2435357), our present results have shown that the odds ratios have the same magnitudes, suggesting that the cases studied here are representative of Hirschsprung disease (Table 4). Regarding the 20 positive markers, we observed that certain alleles and genotypes presented markedly higher frequencies in the HSCR group than in the control group, such as the T allele and TT genotype of RET rs2435357, the A allele and AA genotype of ARHGEF3 rs3732508, and the G allele and GG genotype of CTNNAL1 rs4978379. Moreover, we also employed Plink software to perform the adjustment for age and gender factors, and all 20 positive polymorphisms survived the correction.
Table 1. Allele and genotype distributions of RET among HSCR patients and normal controls.
| SNP ID | Genotype frequency (%) | H-W check p value* | P value* | FDR adjusted | Allele frequency (%) | X2 | P value* | FDR adjusted | Odds Ratio (95%CI) | ||||||||||||||||||||||||||||||||||||||||||||||||||||||||||||||||||||||||||||||||||||||||||
| rs2506030 | AA | AG | GG | A | G | ||||||||||||||||||||||||||||||||||||||||||||||||||||||||||||||||||||||||||||||||||||||||||||||
| Case | 15(3.0) | 137(27.5) | 346(69.5) | 0.748 | 9.90 x 10⁻⁹ | 1.16 x 10⁻⁸ | 167(16.8) | 829(83.2) | 37.909 | 7.64 x 10⁻¹⁰ | 8.91 x 10⁻¹⁰ | 0.51 (0.41-0.63) | |||||||||||||||||||||||||||||||||||||||||||||||||||||||||||||||||||||||||||||||||||||||
| Control | 42(8.2) | 205(40.0) | 265(51.8) | 0.790 | 289(28.2) | 735(71.8) | |||||||||||||||||||||||||||||||||||||||||||||||||||||||||||||||||||||||||||||||||||||||||||||
| rs7069590 | CC | CT | TT | C | T | ||||||||||||||||||||||||||||||||||||||||||||||||||||||||||||||||||||||||||||||||||||||||||||||
| Case | 15(3.0) | 134(26.7) | 353(70.3) | 0.600 | 3.32 x 10⁻¹⁰ | 4.23 x 10⁻¹⁰ | 164(16.3) | 840(83.7) | 44.086 | 3.25 x 10⁻¹¹ | 4.14 x 10⁻¹¹ | 0.49 (0.39-0.60) | |||||||||||||||||||||||||||||||||||||||||||||||||||||||||||||||||||||||||||||||||||||||
| Control | 41(8.0) | 212(41.3) | 260(50.7) | 0.808 | 294(28.7) | 732(71.3) | |||||||||||||||||||||||||||||||||||||||||||||||||||||||||||||||||||||||||||||||||||||||||||||
| rs2505998 | AA | AG | GG | A | G | ||||||||||||||||||||||||||||||||||||||||||||||||||||||||||||||||||||||||||||||||||||||||||||||
| Case | 313(62.4) | 161(32.1) | 28(5.6) | 0.231 | 7.86 x 10⁻³² | 5.50 x 10⁻³¹ | 787(78.4) | 217(21.6) | 243.675 | 6.22 x 10-55 | 4.35 x 10-54 | 4.50 (3.70-5.46) | |||||||||||||||||||||||||||||||||||||||||||||||||||||||||||||||||||||||||||||||||||||||
| Control | 101(19.7) | 256(49.9) | 156(30.4) | 0.827 | 458(44.6) | 568(55.4) | |||||||||||||||||||||||||||||||||||||||||||||||||||||||||||||||||||||||||||||||||||||||||||||
| rs2435357 | CC | CT | TT | C | T | ||||||||||||||||||||||||||||||||||||||||||||||||||||||||||||||||||||||||||||||||||||||||||||||
| Case | 25(5.1) | 146(29.7) | 320(65.2) | 0.124 | 1.29 x 10-52 | 1.81 x 10-51 | 196(20.0) | 786(80.0) | 269.208 | 1.69 x 10-60 | 2.37 x 10-59 | 0.20 (0.16-0.24) | |||||||||||||||||||||||||||||||||||||||||||||||||||||||||||||||||||||||||||||||||||||||
| Control | 157(30.8) | 252(49.5) | 100(19.6) | 0.950 | 566(55.6) | 452(44.4) | |||||||||||||||||||||||||||||||||||||||||||||||||||||||||||||||||||||||||||||||||||||||||||||
| rs752978 | CC | CT | TT | C | T | ||||||||||||||||||||||||||||||||||||||||||||||||||||||||||||||||||||||||||||||||||||||||||||||
| Case | 338(67.6) | 140(28.0) | 22(4.4) | 0.131 | 1.38 x 10⁻³⁰ | 6.44 x 10⁻³⁰ | 816(81.6) | 184(18.4) | 143.721 | 4.45 x 10⁻³³ | 2.08 x 10⁻³² | 3.35 (2.74-4.10) | |||||||||||||||||||||||||||||||||||||||||||||||||||||||||||||||||||||||||||||||||||||||
| Control | 163(32.0) | 255(50.0) | 92(18.0) | 0.655 | 581(57.0) | 439(43.0) | |||||||||||||||||||||||||||||||||||||||||||||||||||||||||||||||||||||||||||||||||||||||||||||
| rs74400468 | CC | CG | GG | C | G | ||||||||||||||||||||||||||||||||||||||||||||||||||||||||||||||||||||||||||||||||||||||||||||||
| Case | 3(0.6) | 48(9.6) | 449(89.8) | 0.177 | 5.87 x 10⁻⁶ | 6.32 x 10⁻⁶ | 54(5.4) | 946(94.6) | 23.750 | 1.12 x 10⁻⁶ | 1.21 x 10⁻⁶ | 0.44 (0.32-0.62) | |||||||||||||||||||||||||||||||||||||||||||||||||||||||||||||||||||||||||||||||||||||||
| Control | 7(1.4) | 103(20.1) | 402(78.5) | 0.890 | 117(11.4) | 907(88.6) | |||||||||||||||||||||||||||||||||||||||||||||||||||||||||||||||||||||||||||||||||||||||||||||
| rs3026737 | CC | CT | TT | C | T | ||||||||||||||||||||||||||||||||||||||||||||||||||||||||||||||||||||||||||||||||||||||||||||||
| Case | 211(42.4) | 234(47.0) | 53(10.6) | 0.316 | 0.502 | > 0.05 | 656(65.9) | 340(34.1) | 0.016 | 0.899 | > 0.05 | 1.01 (0.84-1.22) | |||||||||||||||||||||||||||||||||||||||||||||||||||||||||||||||||||||||||||||||||||||||
| Control | 224(43.7) | 225(43.9) | 64(12.5) | 0.522 | 673(65.6) | 353(34.4) | |||||||||||||||||||||||||||||||||||||||||||||||||||||||||||||||||||||||||||||||||||||||||||||
| rs1864402 | GG | GT | TT | G | T | ||||||||||||||||||||||||||||||||||||||||||||||||||||||||||||||||||||||||||||||||||||||||||||||
| Case | 267(53.7) | 185(37.2) | 45(9.1) | 0.119 | 2.80 x 10⁻¹¹ | 4.36 x 10⁻¹¹ | 719(72.3) | 275(27.7) | 50.250 | 1.41 x 10⁻¹² | 1.97 x 10⁻¹² | 1.95 (1.62-2.35) | |||||||||||||||||||||||||||||||||||||||||||||||||||||||||||||||||||||||||||||||||||||||
| Control | 169(33.1) | 247(48.3) | 95(18.6) | 0.776 | 585(57.2) | 437(42.8) | |||||||||||||||||||||||||||||||||||||||||||||||||||||||||||||||||||||||||||||||||||||||||||||
| rs2075910 | AA | AG | GG | A | G | ||||||||||||||||||||||||||||||||||||||||||||||||||||||||||||||||||||||||||||||||||||||||||||||
| Case | 280(56.2) | 178(35.7) | 40(8.0) | 0.124 | 7.72 x 10⁻²⁴ | 2.16 x 10⁻²³ | 738(74.1) | 258(25.9) | 116.026 | 5.05 x 10⁻²⁷ | 1.18 x 10⁻²⁶ | 2.76 (2.29-3.33) | |||||||||||||||||||||||||||||||||||||||||||||||||||||||||||||||||||||||||||||||||||||||
| Control | 137(26.7) | 248(48.3) | 128(25.0) | 0.457 | 522(50.9) | 504(49.1) | |||||||||||||||||||||||||||||||||||||||||||||||||||||||||||||||||||||||||||||||||||||||||||||
| rs2435353 | CC | CT | TT | C | T | ||||||||||||||||||||||||||||||||||||||||||||||||||||||||||||||||||||||||||||||||||||||||||||||
| Case | 386(77.7) | 101(20.3) | 10(2.0) | 0.269 | 3.57 x 10⁻¹¹ | 5.00 x 10⁻¹⁰ | 873(87.8) | 121(12.2) | 52.482 | 4.52 x 10⁻¹³ | 7.03 x 10⁻¹³ | 2.37 (1.87-3.00) | |||||||||||||||||||||||||||||||||||||||||||||||||||||||||||||||||||||||||||||||||||||||
| Control | 298(58.2) | 175(34.2) | 39(7.6) | 0.066 | 771(75.3) | 253(24.7) | |||||||||||||||||||||||||||||||||||||||||||||||||||||||||||||||||||||||||||||||||||||||||||||
| rs2075913 | AA | AT | TT | A | T | ||||||||||||||||||||||||||||||||||||||||||||||||||||||||||||||||||||||||||||||||||||||||||||||
| Case | 25(5.0) | 148(29.5) | 328(65.5) | 0.126 | 1.00 x 10⁻²³ | 2.33 x 10⁻²³ | 198(19.8) | 804(80.2) | 116.103 | 4.86 x 10⁻²⁷ | 1.36 x 10⁻²⁶ | 0.34 (0.28-0.42) | |||||||||||||||||||||||||||||||||||||||||||||||||||||||||||||||||||||||||||||||||||||||
| Control | 96(18.8) | 237(46.3) | 179(35.0) | 0.265 | 429(41.9) | 595(58.1) | |||||||||||||||||||||||||||||||||||||||||||||||||||||||||||||||||||||||||||||||||||||||||||||
| rs17028 | CC | CT | TT | C | T | ||||||||||||||||||||||||||||||||||||||||||||||||||||||||||||||||||||||||||||||||||||||||||||||
| Case | 388(77.4) | 104(20.8) | 9(1.8) | 0.511 | 2.36 x 10⁻¹¹ | 4.13 x 10⁻¹¹ | 880(87.8) | 122(12.2) | 53.124 | 3.26 x 10⁻¹³ | 5.71 x 10⁻¹³ | 2.37 (1.87-3.00) | |||||||||||||||||||||||||||||||||||||||||||||||||||||||||||||||||||||||||||||||||||||||
| Control | 298(58.1) | 176(34.3) | 39(7.6) | 0.073 | 772(75.2) | 254(24.8) | |||||||||||||||||||||||||||||||||||||||||||||||||||||||||||||||||||||||||||||||||||||||||||||
| rs2742240 | AA | AT | TT | A | T | ||||||||||||||||||||||||||||||||||||||||||||||||||||||||||||||||||||||||||||||||||||||||||||||
| Case | 38(7.6) | 174(34.9) | 287(57.5) | 0.111 | 3.97 x 10⁻²⁵ | 1.39 x 10⁻²⁴ | 250(25.1) | 748(74.9) | 122.217 | 2.24 x 10⁻²⁸ | 7.84 x 10⁻²⁸ | 0.35 (0.29-0.42) | |||||||||||||||||||||||||||||||||||||||||||||||||||||||||||||||||||||||||||||||||||||||
| Control | 125(24.5) | 248(48.6) | 137(26.9) | 0.543 | 498(48.8) | 522(51.2) | |||||||||||||||||||||||||||||||||||||||||||||||||||||||||||||||||||||||||||||||||||||||||||||
| rs2435355 | CC | CT | TT | C | T | ||||||||||||||||||||||||||||||||||||||||||||||||||||||||||||||||||||||||||||||||||||||||||||||
| Case | 10(2.0) | 103(20.5) | 389(77.5) | 0.306 | 2.35 x 10⁻¹¹ | 4.7 x 10⁻¹¹ | 123(12.3) | 881(87.7) | 53.188 | 3.16 x 10⁻¹³ | 6.32 x 10⁻¹³ | 0.42 (0.33-0.53) | |||||||||||||||||||||||||||||||||||||||||||||||||||||||||||||||||||||||||||||||||||||||
| Control | 39(7.6) | 177(34.5) | 297(57.9) | 0.084 | 255(24.9) | 771(75.1) | |||||||||||||||||||||||||||||||||||||||||||||||||||||||||||||||||||||||||||||||||||||||||||||
| *Pearson's p value, FDR = false discovery rate, SNP = single nucleotide polymorphism, CI = confidence interval, HSCR = Hirschsprung disease. | |||||||||||||||||||||||||||||||||||||||||||||||||||||||||||||||||||||||||||||||||||||||||||||||||||
Table 2. Allele and genotype distributions of ARHGEF3 among HSCR patients and normal controls.
| SNP ID | Genotype frequency (%) | H-W check p value* | P value* | FDR adjusted | Allele frequency (%) | X2 | P value* | FDR adjusted | Odds Ratio (95%CI) | ||||||||||||||||||||||||||||||||||||||||||||||||||||||||||||||||||||||||||||||||||||||||||
| rs11717604 | CC | CT | TT | C | T | ||||||||||||||||||||||||||||||||||||||||||||||||||||||||||||||||||||||||||||||||||||||||||||||
| Case | 219(43.7) | 235(46.9) | 47(9.4) | 0.155 | 0.873 | > 0.05 | 673(67.2) | 329(32.8) | 0.005 | 0.946 | > 0.05 | 1.01(0.84-1.21) | |||||||||||||||||||||||||||||||||||||||||||||||||||||||||||||||||||||||||||||||||||||||
| Control | 226(44.2) | 233(45.6) | 52(10.2) | 0.476 | 685(67.0) | 337(33.0) | |||||||||||||||||||||||||||||||||||||||||||||||||||||||||||||||||||||||||||||||||||||||||||||
| rs4681946 | AA | AG | GG | A | G | ||||||||||||||||||||||||||||||||||||||||||||||||||||||||||||||||||||||||||||||||||||||||||||||
| Case | 212(42.5) | 227(45.5) | 60(12.0) | 0.949 | 0.811 | > 0.05 | 651(65.2) | 347(34.8) | 0.115 | 0.735 | > 0.05 | 1.03(0.86-1.24) | |||||||||||||||||||||||||||||||||||||||||||||||||||||||||||||||||||||||||||||||||||||||
| Control | 216(42.4) | 226(44.3) | 68(13.3) | 0.467 | 658(64.5) | 362(35.5) | |||||||||||||||||||||||||||||||||||||||||||||||||||||||||||||||||||||||||||||||||||||||||||||
| rs11720618 | CC | CG | GG | C | G | ||||||||||||||||||||||||||||||||||||||||||||||||||||||||||||||||||||||||||||||||||||||||||||||
| Case | 32(6.4) | 200(40.1) | 267(53.5) | 0.502 | 0.012 | > 0.05 | 264(26.5) | 734(73.5) | 8.358 | 0.004 | 0.025 | 1.35(1.10-1.66) | |||||||||||||||||||||||||||||||||||||||||||||||||||||||||||||||||||||||||||||||||||||||
| Control | 18(3.5) | 178(34.9) | 314(61.6) | 0.235 | 214(21.0) | 806(79.0) | |||||||||||||||||||||||||||||||||||||||||||||||||||||||||||||||||||||||||||||||||||||||||||||
| rs13070800 | CC | CT | TT | C | T | ||||||||||||||||||||||||||||||||||||||||||||||||||||||||||||||||||||||||||||||||||||||||||||||
| Case | 84(16.8) | 236(47.3) | 179(35.9) | 0.679 | 0.889 | > 0.05 | 404(40.5) | 594(59.5) | 0.211 | 0.646 | > 0.05 | 0.96(0.80-1.15) | |||||||||||||||||||||||||||||||||||||||||||||||||||||||||||||||||||||||||||||||||||||||
| Control | 89(17.4) | 246(48.1) | 176(34.4) | 0.849 | 424(41.5) | 598(58.5) | |||||||||||||||||||||||||||||||||||||||||||||||||||||||||||||||||||||||||||||||||||||||||||||
| rs11925835 | CC | CT | TT | C | T | ||||||||||||||||||||||||||||||||||||||||||||||||||||||||||||||||||||||||||||||||||||||||||||||
| Case | 61(12.2) | 223(44.6) | 216(43.2) | 0.768 | 0.039 | > 0.05 | 345(34.5) | 655(65.5) | 6.553 | 0.010 | 0.045 | 1.28(1.06-1.54) | |||||||||||||||||||||||||||||||||||||||||||||||||||||||||||||||||||||||||||||||||||||||
| Control | 44(8.6) | 211(41.2) | 257(50.2) | 0.941 | 299(29.2) | 725(70.8) | |||||||||||||||||||||||||||||||||||||||||||||||||||||||||||||||||||||||||||||||||||||||||||||
| rs3732508 | AA | AG | GG | A | G | ||||||||||||||||||||||||||||||||||||||||||||||||||||||||||||||||||||||||||||||||||||||||||||||
| Case | 28(5.6) | 201(40.4) | 269(54.0) | 0.227 | 0.003 | 0.033 | 257(25.8) | 739(74.2) | 10.315 | 0.001 | 0.017 | 1.41(1.14-1.74) | |||||||||||||||||||||||||||||||||||||||||||||||||||||||||||||||||||||||||||||||||||||||
| Control | 22(4.3) | 158(31.0) | 330(64.7) | 0.577 | 202(19.8) | 818(80.2) | |||||||||||||||||||||||||||||||||||||||||||||||||||||||||||||||||||||||||||||||||||||||||||||
| rs9882898 | AA | AG | GG | A | G | ||||||||||||||||||||||||||||||||||||||||||||||||||||||||||||||||||||||||||||||||||||||||||||||
| Case | 244(49.0) | 211(42.4) | 43(8.6) | 0.784 | 0.189 | > 0.05 | 699(70.2) | 297(29.8) | 3.262 | 0.071 | > 0.05 | 1.19(0.99-1.43) | |||||||||||||||||||||||||||||||||||||||||||||||||||||||||||||||||||||||||||||||||||||||
| Control | 226(44.2) | 227(44.4) | 58(11.4) | 0.930 | 679(66.4) | 343(33.6) | |||||||||||||||||||||||||||||||||||||||||||||||||||||||||||||||||||||||||||||||||||||||||||||
| rs3732509 | CC | CG | GG | C | G | ||||||||||||||||||||||||||||||||||||||||||||||||||||||||||||||||||||||||||||||||||||||||||||||
| Case | 33(6.6) | 197(39.5) | 269(53.9) | 0.703 | 0.529 | > 0.05 | 263(26.4) | 735(73.6) | 1.234 | 0.267 | > 0.05 | 0.90(0.74-1.09) | |||||||||||||||||||||||||||||||||||||||||||||||||||||||||||||||||||||||||||||||||||||||
| Control | 41(8.0) | 211(41.1) | 261(50.9) | 0.856 | 293(28.6) | 733(71.4) | |||||||||||||||||||||||||||||||||||||||||||||||||||||||||||||||||||||||||||||||||||||||||||||
| rs3772219 | AA | AC | CC | A | C | ||||||||||||||||||||||||||||||||||||||||||||||||||||||||||||||||||||||||||||||||||||||||||||||
| Case | 193(38.5) | 240(47.9) | 68(13.6) | 0.627 | 0.934 | > 0.05 | 626(62.5) | 376(37.5) | 0.046 | 0.830 | > 0.05 | 1.02(0.85-1.22) | |||||||||||||||||||||||||||||||||||||||||||||||||||||||||||||||||||||||||||||||||||||||
| Control | 192(37.5) | 251(49.0) | 69(13.5) | 0.359 | 635(62.0) | 389(38.0) | |||||||||||||||||||||||||||||||||||||||||||||||||||||||||||||||||||||||||||||||||||||||||||||
| rs3732511 | CC | CG | GG | C | G | ||||||||||||||||||||||||||||||||||||||||||||||||||||||||||||||||||||||||||||||||||||||||||||||
| Case | 222(44.5) | 220(44.1) | 57(11.4) | 0.823 | 0.988 | > 0.05 | 664(66.5) | 334(33.5) | 0.012 | 0.912 | > 0.05 | 0.99(0.82-1.19) | |||||||||||||||||||||||||||||||||||||||||||||||||||||||||||||||||||||||||||||||||||||||
| Control | 229(44.6) | 227(44.2) | 57(11.1) | 0.947 | 685(66.8) | 341(33.2) | |||||||||||||||||||||||||||||||||||||||||||||||||||||||||||||||||||||||||||||||||||||||||||||
| rs1009119 | CC | CT | TT | C | T | ||||||||||||||||||||||||||||||||||||||||||||||||||||||||||||||||||||||||||||||||||||||||||||||
| Case | 57(11.4) | 219(43.9) | 223(44.7) | 0.771 | 0.985 | > 0.05 | 333(33.4) | 665(66.6) | 0.004 | 0.950 | > 0.05 | 1.01(0.84-1.21) | |||||||||||||||||||||||||||||||||||||||||||||||||||||||||||||||||||||||||||||||||||||||
| Control | 57(11.1) | 227(44.2) | 229(44.6) | 0.947 | 341(33.2) | 685(66.8) | |||||||||||||||||||||||||||||||||||||||||||||||||||||||||||||||||||||||||||||||||||||||||||||
| rs6978 | AA | AG | GG | A | G | ||||||||||||||||||||||||||||||||||||||||||||||||||||||||||||||||||||||||||||||||||||||||||||||
| Case | 56(11.2) | 217(43.6) | 225(45.2) | 0.736 | 0.978 | > 0.05 | 329(33.0) | 667(67.0) | 0.013 | 0.910 | > 0.05 | 0.99(0.82-1.19) | |||||||||||||||||||||||||||||||||||||||||||||||||||||||||||||||||||||||||||||||||||||||
| Control | 57(11.2) | 226(44.2) | 228(44.6) | 0.929 | 340(33.3) | 682(66.7) | |||||||||||||||||||||||||||||||||||||||||||||||||||||||||||||||||||||||||||||||||||||||||||||
| rs808 | AA | AG | GG | A | G | ||||||||||||||||||||||||||||||||||||||||||||||||||||||||||||||||||||||||||||||||||||||||||||||
| Case | 309(61.7) | 171(34.1) | 21(4.2) | 0.662 | 0.857 | > 0.05 | 789(78.7) | 213(21.3) | 0.050 | 0.823 | > 0.05 | 1.02(0.83-1.27) | |||||||||||||||||||||||||||||||||||||||||||||||||||||||||||||||||||||||||||||||||||||||
| Control | 314(61.6) | 171(33.5) | 25(4.9) | 0.782 | 799(78.3) | 221(21.7) | |||||||||||||||||||||||||||||||||||||||||||||||||||||||||||||||||||||||||||||||||||||||||||||
| *Pearson's p value, FDR = false discovery rate, SNP = single nucleotide polymorphism, CI = confidence interval, HSCR = Hirschsprung disease. | |||||||||||||||||||||||||||||||||||||||||||||||||||||||||||||||||||||||||||||||||||||||||||||||||||
Table 3. Allele and genotype distributions of CTNNAL1 among HSCR patients and normal controls.
| SNP ID | Genotype frequency (%) | H-W check p value* | P value* | FDR adjusted | Allele frequency (%) | X2 | P value* | FDR adjusted | Odds Ratio (95%CI) | ||||||||||||||||||||||||||||||||||||||||||||||||||||||||||||||||||||||||||||||||||||||||||
| rs10816766 | CC | CT | TT | C | T | ||||||||||||||||||||||||||||||||||||||||||||||||||||||||||||||||||||||||||||||||||||||||||||||
| Case | 32(6.4) | 164(32.7) | 305(60.9) | 0.123 | 0.249 | > 0.05 | 228(22.8) | 774 (77.2) | 0.484 | 0.487 | > 0.05 | 1.08(0.87-1.33) | |||||||||||||||||||||||||||||||||||||||||||||||||||||||||||||||||||||||||||||||||||||||
| Control | 21(4.1) | 177(34.7) | 312(61.2) | 0.510 | 219(21.5) | 801(78.5) | |||||||||||||||||||||||||||||||||||||||||||||||||||||||||||||||||||||||||||||||||||||||||||||
| rs10979650 | AA | AG | GG | A | G | ||||||||||||||||||||||||||||||||||||||||||||||||||||||||||||||||||||||||||||||||||||||||||||||
| Case | 23(4.6) | 146(29.3) | 330(66.1) | 0.192 | 0.017 | > 0.05 | 192(19.2) | 806(80.8) | 7.241 | 0.007 | 0.039 | 1.38(1.09-1.74) | |||||||||||||||||||||||||||||||||||||||||||||||||||||||||||||||||||||||||||||||||||||||
| Control | 10(2.0) | 131(25.6) | 371(72.5) | 0.690 | 151(14.7) | 873(85.3) | |||||||||||||||||||||||||||||||||||||||||||||||||||||||||||||||||||||||||||||||||||||||||||||
| rs4978766 | AA | AG | GG | A | G | ||||||||||||||||||||||||||||||||||||||||||||||||||||||||||||||||||||||||||||||||||||||||||||||
| Case | 333(66.3) | 147(29.3) | 22(4.4) | 0.267 | 0.025 | > 0.05 | 813(81.0) | 191(19.0) | 6.617 | 0.010 | 0.028 | 0.73(0.58-0.93) | |||||||||||||||||||||||||||||||||||||||||||||||||||||||||||||||||||||||||||||||||||||||
| Control | 371(72.5) | 131(25.6) | 10(2.0) | 0.690 | 873(85.3) | 151(14.7) | |||||||||||||||||||||||||||||||||||||||||||||||||||||||||||||||||||||||||||||||||||||||||||||
| rs4978379 | CC | CG | GG | C | G | ||||||||||||||||||||||||||||||||||||||||||||||||||||||||||||||||||||||||||||||||||||||||||||||
| Case | 327(65.5) | 146(29.3) | 26(5.2) | 0.073 | 0.005 | > 0.05 | 800(80.2) | 198(19.8) | 9.437 | 0.002 | 0.023 | 0.70(0.55-0.88) | |||||||||||||||||||||||||||||||||||||||||||||||||||||||||||||||||||||||||||||||||||||||
| Control | 371(72.6) | 130(25.4) | 10(2.0) | 0.722 | 872(85.3) | 150(14.7) | |||||||||||||||||||||||||||||||||||||||||||||||||||||||||||||||||||||||||||||||||||||||||||||
| rs2282206 | AA | AG | GG | A | G | ||||||||||||||||||||||||||||||||||||||||||||||||||||||||||||||||||||||||||||||||||||||||||||||
| Case | 144(28.8) | 248(49.6) | 108(21.6) | 0.950 | 0.768 | > 0.05 | 536(53.6) | 464(46.4) | 0.104 | 0.748 | > 0.05 | 0.97(0.82-1.16) | |||||||||||||||||||||||||||||||||||||||||||||||||||||||||||||||||||||||||||||||||||||||
| Control | 156(30.6) | 242(47.5) | 112(22.0) | 0.322 | 554(54.3) | 466(45.7) | |||||||||||||||||||||||||||||||||||||||||||||||||||||||||||||||||||||||||||||||||||||||||||||
| rs838816 | CC | CT | TT | C | T | ||||||||||||||||||||||||||||||||||||||||||||||||||||||||||||||||||||||||||||||||||||||||||||||
| Case | 113(22.6) | 251(50.2) | 136(27.2) | 0.891 | 0.600 | > 0.05 | 477(47.7) | 523(52.3) | 0.140 | 0.708 | > 0.05 | 1.03(0.87-1.23) | |||||||||||||||||||||||||||||||||||||||||||||||||||||||||||||||||||||||||||||||||||||||
| Control | 119(23.3) | 241(47.2) | 151(29.5) | 0.231 | 479(46.9) | 543(53.1) | |||||||||||||||||||||||||||||||||||||||||||||||||||||||||||||||||||||||||||||||||||||||||||||
| rs838817 | CC | CT | TT | C | T | ||||||||||||||||||||||||||||||||||||||||||||||||||||||||||||||||||||||||||||||||||||||||||||||
| Case | 141(28.1) | 249(49.7) | 111(22.2) | 0.957 | 0.614 | > 0.05 | 531(53.0) | 471(47.0) | 0.250 | 0.617 | > 0.05 | 0.96(0.80-1.14) | |||||||||||||||||||||||||||||||||||||||||||||||||||||||||||||||||||||||||||||||||||||||
| Control | 157(30.7) | 240(46.9) | 115(22.5) | 0.204 | 554(54.1) | 470(45.9) | |||||||||||||||||||||||||||||||||||||||||||||||||||||||||||||||||||||||||||||||||||||||||||||
| rs7021366 | CC | CG | GG | C | G | ||||||||||||||||||||||||||||||||||||||||||||||||||||||||||||||||||||||||||||||||||||||||||||||
| Case | 195(39.0) | 235(47.0) | 70(14.0) | 0.952 | 0.020 | > 0.05 | 625(62.5) | 375(37.5) | 7.169 | 0.007 | 0.027 | 0.78(0.65-0.95) | |||||||||||||||||||||||||||||||||||||||||||||||||||||||||||||||||||||||||||||||||||||||
| Control | 244(47.7) | 210(41.0) | 58(11.3) | 0.214 | 698(68.2) | 326(31.8) | |||||||||||||||||||||||||||||||||||||||||||||||||||||||||||||||||||||||||||||||||||||||||||||
| rs7027874 | AA | AG | GG | A | G | ||||||||||||||||||||||||||||||||||||||||||||||||||||||||||||||||||||||||||||||||||||||||||||||
| Case | 143(28.7) | 243(48.8) | 112(22.5) | 0.651 | 0.784 | > 0.05 | 529(53.1) | 467(46.9) | 0.443 | 0.505 | > 0.05 | 0.94(0.79-1.12) | |||||||||||||||||||||||||||||||||||||||||||||||||||||||||||||||||||||||||||||||||||||||
| Control | 157(30.7) | 245(047.9) | 110(21.5) | 0.431 | 559(54.6) | 465(45.4) | |||||||||||||||||||||||||||||||||||||||||||||||||||||||||||||||||||||||||||||||||||||||||||||
| rs2289481 | CC | CG | GG | C | G | ||||||||||||||||||||||||||||||||||||||||||||||||||||||||||||||||||||||||||||||||||||||||||||||
| Case | 111(22.2) | 246(49.3) | 142(28.5) | 0.820 | 0.711 | > 0.05 | 468(46.9) | 530(53.1) | 0.386 | 0.534 | > 0.05 | 1.06(0.89-1.26) | |||||||||||||||||||||||||||||||||||||||||||||||||||||||||||||||||||||||||||||||||||||||
| Control | 112(21.8) | 243(47.4) | 158(30.8) | 0.309 | 467(45.5) | 559(54.5) | |||||||||||||||||||||||||||||||||||||||||||||||||||||||||||||||||||||||||||||||||||||||||||||
| rs2289480 | AA | AC | CC | A | C | ||||||||||||||||||||||||||||||||||||||||||||||||||||||||||||||||||||||||||||||||||||||||||||||
| Case | 141(28.3) | 246(49.3) | 112(22.4) | 0.811 | 0.673 | > 0.05 | 528(52.9) | 470(47.1) | 0.506 | 0.477 | > 0.05 | 0.94(0.79-1.12) | |||||||||||||||||||||||||||||||||||||||||||||||||||||||||||||||||||||||||||||||||||||||
| Control | 158(30.8) | 243(47.4) | 112(21.8) | 0.309 | 559(54.5) | 467(45.5) | |||||||||||||||||||||||||||||||||||||||||||||||||||||||||||||||||||||||||||||||||||||||||||||
| *Pearson's p value, FDR = false discovery rate, SNP = single nucleotide polymorphism, CI = confidence interval, HSCR = Hirschsprung disease. | |||||||||||||||||||||||||||||||||||||||||||||||||||||||||||||||||||||||||||||||||||||||||||||||||||
Table 4. The comparison of 4 HSCR-associated genetic variants in RET between previous findings and the present results.
| SNP ID | Groups | Risk/Non-risk allele | Risk allele frequency (Case/Control) | Odds Ratio (95%CI) | P value* | ||||||||||||||||||||||||||||||||||||||||||||||||||||||||||||||||||||||||||||||||||||||||||||||
| rs2506030 | Previous findings** | G/A | 0.54/0.40 | 1.7(1.4-2.2) | 2.2 x 10⁻⁶ | ||||||||||||||||||||||||||||||||||||||||||||||||||||||||||||||||||||||||||||||||||||||||||||||
| The present results | 0.83/0.72 | 2.0(1.6-2.4) | 8.9 x 10⁻¹⁰ | ||||||||||||||||||||||||||||||||||||||||||||||||||||||||||||||||||||||||||||||||||||||||||||||||
| rs7069590 | Previous findings** | T/C | 0.84/0.74 | 1.8(1.3-2.5) | 9.7 x 10⁻⁵ | ||||||||||||||||||||||||||||||||||||||||||||||||||||||||||||||||||||||||||||||||||||||||||||||
| The present results | 0.84/0.71 | 2.1(1.7-2.5) | 4.1 x 10⁻¹¹ | ||||||||||||||||||||||||||||||||||||||||||||||||||||||||||||||||||||||||||||||||||||||||||||||||
| rs2505998 | Previous findings** | A/G | 0.64/0.22 | 4.2(3.2-5.3) | 1.1 x 10⁻²⁸ | ||||||||||||||||||||||||||||||||||||||||||||||||||||||||||||||||||||||||||||||||||||||||||||||
| The present results | 0.78/0.45 | 4.5(3.7-5.5) | 4.4 x 10-54 | ||||||||||||||||||||||||||||||||||||||||||||||||||||||||||||||||||||||||||||||||||||||||||||||||
| rs2435357 | Previous findings** | T/C | 0.59/0.23 | 4.8(3.8-6.1) | 6.0 x 10-40 | ||||||||||||||||||||||||||||||||||||||||||||||||||||||||||||||||||||||||||||||||||||||||||||||
| The present results | 0.80/0.44 | 5.0(4.1-6.1) | 2.4 x 10-59 | ||||||||||||||||||||||||||||||||||||||||||||||||||||||||||||||||||||||||||||||||||||||||||||||||
| *Pearson's p value, **European studies [14, 26], FDR = false discovery rate, SNP = single nucleotide polymorphism, CI = confidence interval, HSCR = Hirschsprung disease. | |||||||||||||||||||||||||||||||||||||||||||||||||||||||||||||||||||||||||||||||||||||||||||||||||||
Linkage disequilibrium analysis
We further conducted linkage disequilibrium (LD) analyses of genetic markers within the RET, ARHGEF, and CTNNAL1 genes since LD makes tightly linked SNPs markedly correlated, leading to cost savings for association studies [22]. Figure 1 presents LD results for each pair of genetic variants in the HSCR group and control group. Strong LD (D' > 0.7) was found in multiple groups of markers, such as RET_rs2435353-rs2075913-rs17028, ARHGEF3_rs11720618-rs11925835-rs3732508 rs3732511-rs1009119-rs6978, CTNNAL1_rs10979650-rs4978766-rs4978379-rs838816-rs7021366 and etc. We therefore investigated the haplotype distributions for these SNPs in the later analysis.
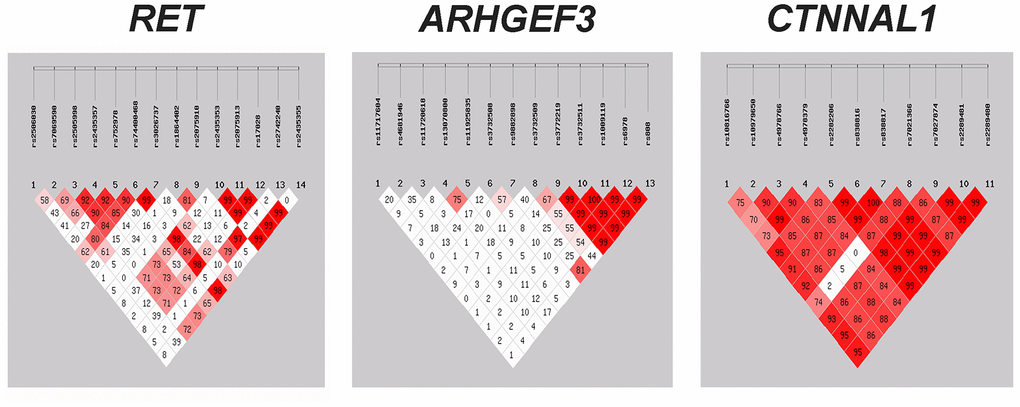
Figure 1. Assessment of linkage disequilibrium (LD) between the genetic variants within RET, ARHGEF3 and CTNNAL1. The matrices represent the D' value between the SNP pairs. Red matrices denote D' > 70%. SNP = single nucleotide polymorphism.
Haplotype analysis and power calculations
Since haplotype constructed from genetic markers with strong LD (D' > 0.7) will markedly increase the statistical power for association with the disease, we then carried out haplotype analyses of SNPs in these three genes. Moreover, haplotypes were omitted from the analysis if the estimated haplotype probabilities were less than 3% in either the HSCR or control group. Only haplotypes with strong LD were selected for presentation (Supplementary Table 1). In the present study, we observed that multiple haplotypes were significantly associated with HSCR. For the 38 genetic variants within these three genes, haplotype analysis also unraveled some significant global P values (Table 5). For each gene, the most significant haplotypes included RET_ rs2435357-rs752978-rs74400468-rs2435353-rs2075913-rs17028-rs2435355 (P = 3.79×10-58), ARHGEF3_rs11720618-rs11925835-rs3732508-rs3772219-rs3732511-rs1009119-rs6978-rs8 08 (P = 2.99×10⁻⁸), and CTNNAL1_rs10979650-rs4978 766-rs4978379-rs838816-rs7021366 (P = 5.05×10⁻⁵). Importantly, we found that the combinations of the RET risk haplotype reported previously [23] and the risk alleles of ARHGEF3 and/or CTNNAL1 showed increased odds ratios compared to those consisting of only the RET risk haplotype and the non-risk alleles of ARHGEF3 and/or CTNNAL1 (Supplementary Table 2). By using the G*Power 3 program, we demonstrated that our sample size had > 90% power to detect a significant association (α < 0.05) for genetic markers when an effect size index of 0.22 (corresponding to a "weak" gene effect) was adopted.
Table 5. Global p values of estimated haplotypes.
| Gene ID | Haplotype | Global p value* | |||||||||||||||||||||||||||||||||||||||||||||||||||||||||||||||||||||||||||||||||||||||||||||||||
| RET | rs2435353-rs2075913-rs17028 | 3.66 x 10⁻²⁶ | |||||||||||||||||||||||||||||||||||||||||||||||||||||||||||||||||||||||||||||||||||||||||||||||||
| rs74400468-rs2435353-rs2075913-rs17028-rs2435355 | 5.40 x 10⁻²⁸ | ||||||||||||||||||||||||||||||||||||||||||||||||||||||||||||||||||||||||||||||||||||||||||||||||||
| rs1864402-rs2075910-rs2742240 | 2.03 x 10⁻²⁶ | ||||||||||||||||||||||||||||||||||||||||||||||||||||||||||||||||||||||||||||||||||||||||||||||||||
| rs2435357-rs752978-rs74400468 | 5.56 x 10-56 | ||||||||||||||||||||||||||||||||||||||||||||||||||||||||||||||||||||||||||||||||||||||||||||||||||
| rs2505998-rs2435357-rs752978-rs74400468-rs2435353-rs2075913-rs17028-rs2435355 | 1.46 x 10-57 | ||||||||||||||||||||||||||||||||||||||||||||||||||||||||||||||||||||||||||||||||||||||||||||||||||
| rs2435357-rs752978-rs74400468-rs2435353-rs2075913-rs17028-rs2435355 | 3.79 x 10-58 | ||||||||||||||||||||||||||||||||||||||||||||||||||||||||||||||||||||||||||||||||||||||||||||||||||
| ARHGEF3 | rs11720618-rs11925835-rs3732508-rs9882898-rs3732509-rs3772219-rs3732511-rs100911-rs6978-rs808 | 2.95 x 10⁻⁶ | |||||||||||||||||||||||||||||||||||||||||||||||||||||||||||||||||||||||||||||||||||||||||||||||||
| rs11720618-rs11925835-rs3732508 | 5.38 x 10⁻⁴ | ||||||||||||||||||||||||||||||||||||||||||||||||||||||||||||||||||||||||||||||||||||||||||||||||||
| rs11720618-rs11925835-rs3732508-rs3732511-rs1009119-rs6978 | 1.67 x 10⁻⁵ | ||||||||||||||||||||||||||||||||||||||||||||||||||||||||||||||||||||||||||||||||||||||||||||||||||
| rs11720618-rs11925835-rs3732508-rs3772219-rs3732511-rs1009119-rs6978-rs808 | 2.99 x 10⁻⁸ | ||||||||||||||||||||||||||||||||||||||||||||||||||||||||||||||||||||||||||||||||||||||||||||||||||
| CTNNAL1 | rs10816766-rs10979650-rs4978766-rs4978379-rs2282206-rs838816-rs838817-rs7021366-rs7027874-rs2289481-rs2289480 | 0.236 | |||||||||||||||||||||||||||||||||||||||||||||||||||||||||||||||||||||||||||||||||||||||||||||||||
| rs10979650-rs4978766-rs4978379 | 0.063 | ||||||||||||||||||||||||||||||||||||||||||||||||||||||||||||||||||||||||||||||||||||||||||||||||||
| rs10979650-rs4978766-rs4978379-rs7021366 | 0.050 | ||||||||||||||||||||||||||||||||||||||||||||||||||||||||||||||||||||||||||||||||||||||||||||||||||
| rs10979650-rs4978766-rs4978379-rs7021366-rs7027874-rs2289481-rs2289480 | 0.096 | ||||||||||||||||||||||||||||||||||||||||||||||||||||||||||||||||||||||||||||||||||||||||||||||||||
| rs10979650-rs4978766-rs4978379-rs838816-rs7021366 | 5.05 x 10⁻⁵ | ||||||||||||||||||||||||||||||||||||||||||||||||||||||||||||||||||||||||||||||||||||||||||||||||||
| rs10979650-rs4978766-rs4978379-rs7021366-rs7027874 | 0.105 | ||||||||||||||||||||||||||||||||||||||||||||||||||||||||||||||||||||||||||||||||||||||||||||||||||
| rs10979650-rs4978766-rs4978379-rs7021366-rs2289481 | 0.112 | ||||||||||||||||||||||||||||||||||||||||||||||||||||||||||||||||||||||||||||||||||||||||||||||||||
| rs10816766-rs10979650-rs4978766-rs4978379-rs7021366 | 0.114 | ||||||||||||||||||||||||||||||||||||||||||||||||||||||||||||||||||||||||||||||||||||||||||||||||||
| *Pearson's p value, statistical significance set at p<0.05, SNP = single nucleotide polymorphism. | |||||||||||||||||||||||||||||||||||||||||||||||||||||||||||||||||||||||||||||||||||||||||||||||||||
Genetic interaction network analysis
The multifactor dimensionality reduction (MDR) strategy was then recruited to assess the potential gene-gene interactions among RET, ARHGEF3 and CTNNAL1 (Figure 2A, 2B). Of note, the MDR analysis showed the best interaction models regarding HSCR risk, and accordingly, RET (rs7069590) was the best single factor model (Testing accuracy = 0.6337; Cross-validation consistency = 10/10) (Table 6). Moreover, the best two-factor model consisted of RET (rs3026737) and ARHGEF3 (rs4681946), and specifically, certain genotype combinations, such as CT (rs3026737)-AA (rs4681946), might lead to an increased risk in HSCR (Figure 2B). On the other hand, RET (rs7069590), ARHGEF3 (rs11717604), ARHGEF3 (rs3732508), and CTNNAL1 (rs7021366) constituted the best four-factor model (Testing accuracy = 0.5941; Cross-validation consistency = 10/10).
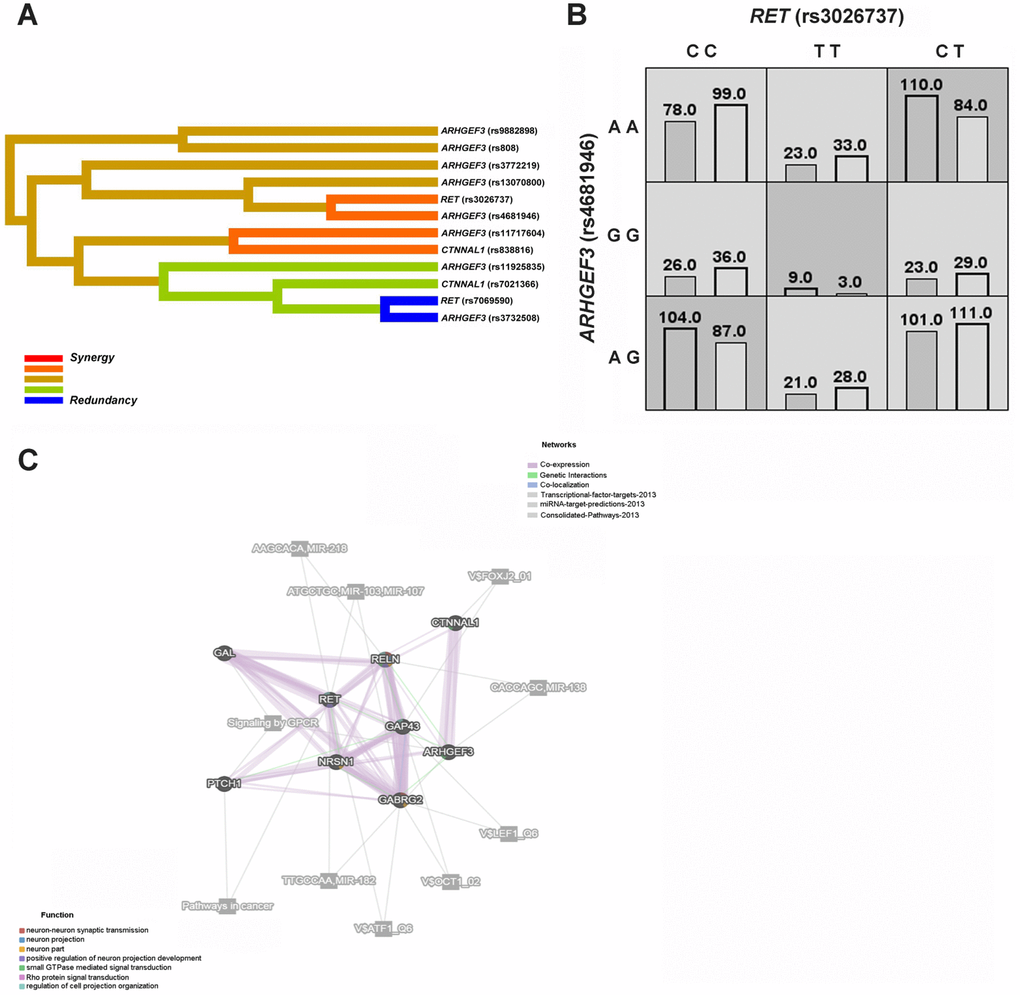
Figure 2. HSCR-related genetic interaction networks among RET, ARHGEF3, CTNNAL1 and our previously studied GAL, GAP43, NRSN1, PTCH1, GABRG2 and RELN gene. (A) The interaction dendrogram derived from MDR (Multifactor dimensionality reduction). Short connections among nodes represent stronger synergistic (red and orange) or redundant (green and blue) interactions. (B) In the two-factor best model, multilocus genotype combinations are linked to the altered HSCR risk. Darker-shaded cells represent higher risk combinations compared with lighter-shaded cells. Each cell denotes counts of HSCR subjects on left and controls on right. (C) The genetic interaction networks derived from GeneMANIA. The 9 HSCR-associated genes are linked to each other by the functional association networks in the GeneMANIA system.
Table 6. Gene-gene interaction models for SNPs in HSCR risk by MDR analysis.
| Number of factors | Best model* | Training accuracy | Testing accuracy | CVC | X2 | P value | Odds Ratio (95%CI) | ||||||||||||||||||||||||||||||||||||||||||||||||||||||||||||||||||||||||||||||||||||||||||||
| 1 | RET(rs7069590) | 0.593 | 0.6337 | 10/10 | 33.705 | <0.0001 | 2.22(1.69-2.91) | ||||||||||||||||||||||||||||||||||||||||||||||||||||||||||||||||||||||||||||||||||||||||||||
| 2 | RET(rs3026737)-ARHGEF3(rs4681946) | 0.5569 | 0.5743 | 10/10 | 11.830 | 0.0006 | 1.59(1.22-2.08) | ||||||||||||||||||||||||||||||||||||||||||||||||||||||||||||||||||||||||||||||||||||||||||||
| 3 | RET(rs3026737)-RET(rs7069590)-ARHGEF3(rs11925835) | 0.6193 | 0.6238 | 10/10 | 55.266 | <0.0001 | 2.80(2.13-3.69) | ||||||||||||||||||||||||||||||||||||||||||||||||||||||||||||||||||||||||||||||||||||||||||||
| 4 | RET(rs7069590)-ARHGEF3(rs11717604)-ARHGEF3(rs3732508)-CTNNAL1(rs7021366) | 0.6477 | 0.5941 | 10/10 | 79.921 | <0.0001 | 3.41(2.59-4.47) | ||||||||||||||||||||||||||||||||||||||||||||||||||||||||||||||||||||||||||||||||||||||||||||
| *The best model was referred to as the one with the maximum testing accuracy and maximum cross-validation consistency (CVC); MDR = multifactor dimensionality reduction, CI = confidence interval, HSCR = Hirschsprung disease. | |||||||||||||||||||||||||||||||||||||||||||||||||||||||||||||||||||||||||||||||||||||||||||||||||||
We also used GeneMANIA, a flexible user-friendly database, to explore the functional association networks among RET, ARHGEF3, and CTNNAL1 and our previously studied GAL, GAP43, NRSN1, PTCH1, GABRG2 and RELN genes [21]. As shown in Figure 2C, gene function prediction indicated that RET, ARHGEF3, and CTNNAL1 might be involved in the positive regulation of neuron projection development, regulation of cell projection organization, and small GTPase-mediated signal transduction. These nine genes interacted with each other mainly through co-expression and/or genetic interactions, and some of them might contribute to the same pathways, such as signaling by GPCR.
Discussion
HSCR is a congenital complex disorder caused by a deficit in the migration process of enteric neural crest cells (ENCCs). To date, more than 15 genes have been linked to the development of Hirschsprung disease, and yet, the landscape of genetic networks regarding HSCR risk has not been fully characterized. Here, we carried out linkage disequilibrium analyses of 38 genetic markers within the RET, ARHGEF, and CTNNAL1 genes in 502 HSCR cases and 513 normal controls and identified significant associations of these three genes with altered HSCR susceptibility. Moreover, our present work for the first time unraveled that the interaction networks among RET, ARHGEF3, and CTNNAL1 and our previously studied GAL, GAP43, NRSN1, PTCH1, GABRG2 and RELN genes might contribute to an increased risk of HSCR.
Recent genetics studies have mainly focused on the major HSCR gene, RET, which contains at least 80% of all known HSCR-causing mutations [24]. Our present results showed that 13 out of 14 genetic variants within RET were significantly linked to the altered HSCR susceptibility. Of note, certain alleles and/or genotypes of these 13 positive SNPs might be risk factors for HSCR, such as the A allele and AA genotype of rs2505998, the T allele and TT genotype of rs2435357 and the C allele and CC genotype of rs752978, while the others might be protective factors against HSCR, such as the T allele and TT genotype of rs17028 and the C allele and CC genotype of rs2435355. Additionally, the 3 positive markers (rs17028, rs2742240 and rs2435355) may further affect the regulatory mechanisms of gene expression since all of them are located in the 3' UTR region [25]. Regarding the 4 SNPs (rs2506030, rs7069590, rs2505998 and rs2435357) that have been reported in Hirschsprung disease [14, 26], our findings also supported that these 4 markers contribute to the altered HSCR risk.
We then tried to interrogate the relationship between ARHGEF3, CTNNAL1 and HSCR, since both of them were indicated as excellent candidate genes for HSCR [17]. Our current work presented strong associations of ARHGEF3 and CTNNAL1 with Hirschsprung disease. As the positive variant rs3732508 in ARHGEF3 is synonymous, it may not change the amino acid directly, and yet, based on recent studies, synonymous SNPs can affect mRNA splicing, stability and structure as well as protein folding, which may cause changes in protein function and cellular response to therapeutic targets [27]. In humans, ARHGEF3 belongs to the family of RhoGEFs (Rho guanine nucleotide exchange factor), which promote GDP to GTP exchange [28]. A recent study showed that knockdown of ARHGEF3 markedly inhibits NPC (nasopharyngeal carcinoma) cell growth and migration [29]. On the other hand, rs7021366_CTNNAL1, the positive marker, is a missense mutation, which results in a change in the amino acid and thus may substantially have an impact on the function of proteins. CTNNAL1 (α-Catulin) is a cytoplasmic molecule that integrates the crosstalk between nuclear factor-kappa B and Rho signaling pathways, and attenuation of α-Catulin in vitro blocked cell migration and invasion induced by other proteins [30, 31]. Regarding ARHGEF3 and CTNNAL1, our work also revealed some potential risk factors for HSCR, such as the C allele and CC genotype of ARHGEF3 rs11720618, the A allele and AA genotype of ARHGEF3 rs3732508, and the G allele and GG genotype of CTNNAL1 rs7021366, all of which might confer an increased risk of HSCR. Importantly, additional replication studies recruiting larger Asian and non-Asian samples and more markers will certainly be needed in the future.
On the other hand, our current findings also revealed some significant haplotypes, which are relevant to HSCR susceptibility (Table 5 and Supplementary Table 1). Compared with individual SNP analysis, haplotype analysis might increase the power to detect disease-causing loci [32], and in regards to the most significant haplotypes for each gene, some showed markedly higher frequencies in the HSCR group than in the control group, e.g., RET_A-T-C-G-C-T-C-T (rs2505998-rs2435357-rs752978-rs74400468-rs243535 3-rs2075913-rs17028-rs2435355, P = 4.69×10-52, OR = 4.83, 95% CI 3.92-5.96) and ARHGEF3_G-C-A-A-C-T-G-A (rs11720618-rs11925835-rs3732508-rs3772219-rs3732511-rs1009119-rs6978-rs808, P = 1.43×10⁻⁴, OR = 3.78, 95% CI 1.82-7.86), both of which are the potential risk factors for HSCR, whereas CTNNAL1_G-A-C-C-C (rs10979650-rs4978766-rs4978379-rs838816-rs7021366, P = 9.04×10⁻⁶, OR = 0.18, 95% CI 0.08-0.42) exerts a protective effect against HSCR.
Interestingly, both ARHGEF3 and CTNNAL1 map to the RET-dependent HSCR susceptibility loci identified at 3p21 and 9q31, respectively [18, 19]. Since ARHGEF3 encodes a RhoGEF and CTNNAL1 can interact with RhoGEFs, it has been indicated that the two genes potentially interact in the modulation of cell migration [17, 33]. We thus enrolled the multifactor dimensionality reduction (MDR) strategy to explore the gene-gene interactions among RET, ARHGEF3 and CTNNAL1 (Figure 2A, 2B), and interrogated the best interaction model with maximum testing accuracy and maximum cross-validation consistency (CVC) among these three genes. Of note, MDR is a nonparametric model-free method that does not require particular inheritance model to detect gene-gene interactions without main gene effects in case-control studies of complex diseases [34]. In our MDR analysis, the best interaction models also contained certain positive genetic variants associated with HSCR, including RET_rs7069590, ARHGEF3_rs11925835, ARHGEF3_rs3732508 and CTNNAL1_rs7021366 (Table 6). Interestingly, the best four-factor model, RET (rs7069590)-ARHGEF3 (rs11717604)-ARHGEF3 (rs3732508)-CTNNAL1 (rs7021366), showed the most significant OR compared to other models, further supporting that a multifactor model might play a major role in HSCR susceptibility. Since 2 positive cSNPs (ARHGEF3_rs3732508 and CTNNAL1_rs7021366) were also involved in this best four-factor model, the interaction between them might have a functional impact on HSCR pathogenesis.
Taking advantage of the GeneMANIA platform, we then explored functionally related gene-gene interaction networks among RET, ARHGEF3, and CTNNAL1, and our previously studied GAL, GAP43, NRSN1, PTCH1, GABRG2 and RELN genes [21]. These HSCR-associated genes were linked to each other through co-expression, genetic interactions, co-localization, or they might be involved in the same pathways or might be targeted by the same microRNAs (Figure 2C). Moreover, RET, ARHGEF3 and CTNNAL1 might functionally contribute to the regulation of cell projection organization, small GTPase-mediated signal transduction and positive regulation of neuron projection development, and thus they might be involved in HSCR etiology, as HSCR is due to a deficit in the development of the enteric nervous system.
Taken together, our present data show that genetic variants and haplotypes in RET, ARHGEF3 and CTNNAL1 confer an altered risk to Hirschsprung disease in the Han Chinese population. To the best of our knowledge, this study offers the first indication that the gene-gene interactions among RET, ARHGEF3 and CTNNAL1 contribute to an increased risk of HSCR. Moreover, we have also unraveled the potential interaction networks consisting of 9 HSCR-related genes, which might be involved in HSCR susceptibility. Future research is required to fully understand the complexity of genetic interaction networks involved in HSCR risk and address the genetic basis of Hirschsprung disease.
Materials and Methods
Study subjects
In the present study, we recruited 1015 subjects, including 502 sporadic HSCR cases (383 males and 119 females, age 1.34 ± 2.12 years) and 513 normal controls (310 males and 203 females, age 2.70 ± 3.13 years). All the participants were of Han Chinese origin and were enrolled from biologically unrelated residents. The 502 cases in the study had the diagnosis of HSCR based on histological examination of surgical or biopsy resection material, including 369 S-HSCR (short segment HSCR), 74 L-HSCR (long segment HSCR) and 59 TCA (total colonic aganglionosis). Controls were randomly recruited from the general population with no history of chronic constipation. We received approval for the study from Xinhua Hospital and Capital Institute of Pediatrics and obtained written informed consent from participants or their parents after the procedure had been fully explained. DNA was extracted using the QIAamp DNA Blood Midi Kit (Qiagen, Valencia, CA).
SNP selection and genotyping
The tagSNP selection was conducted using the Genome Variation Server (http://gvs.gs.washington.edu/GVS150/) with MAF (minor allele frequency) ≥ 0.15 and r2 ≥ 0.8 according to the HapMap HCB (Han Chinese in Beijing) database. We thus enrolled 38 SNPs in the study, including 34 tagSNPs and 4 SNPs (RET: rs2506030, rs7069590, rs2505998 and rs2435357) that have been previously reported [14, 26]. All 38 SNPs consisted of 6 3' UTR SNPs (RET: rs17028, rs2742240 and rs2435355; ARHGEF3: rs1009119, rs6978 and rs808), 4 cSNPs (coding SNPs) (ARHGEF3: rs3732508, rs3772219 and rs3732511; CTNNAL1: rs7021366), and 28 intronic SNPs (Figure 3A). Genotyping was performed using the MassARRAY iPLEX Gold system (Sequenom, San Diego, CA), and Figure 3B presents representative mass spectra of the 14 genetic variants in the RET gene. Additionally, we recruited multiple criteria for genotyping quality control, similar to previous study [21].
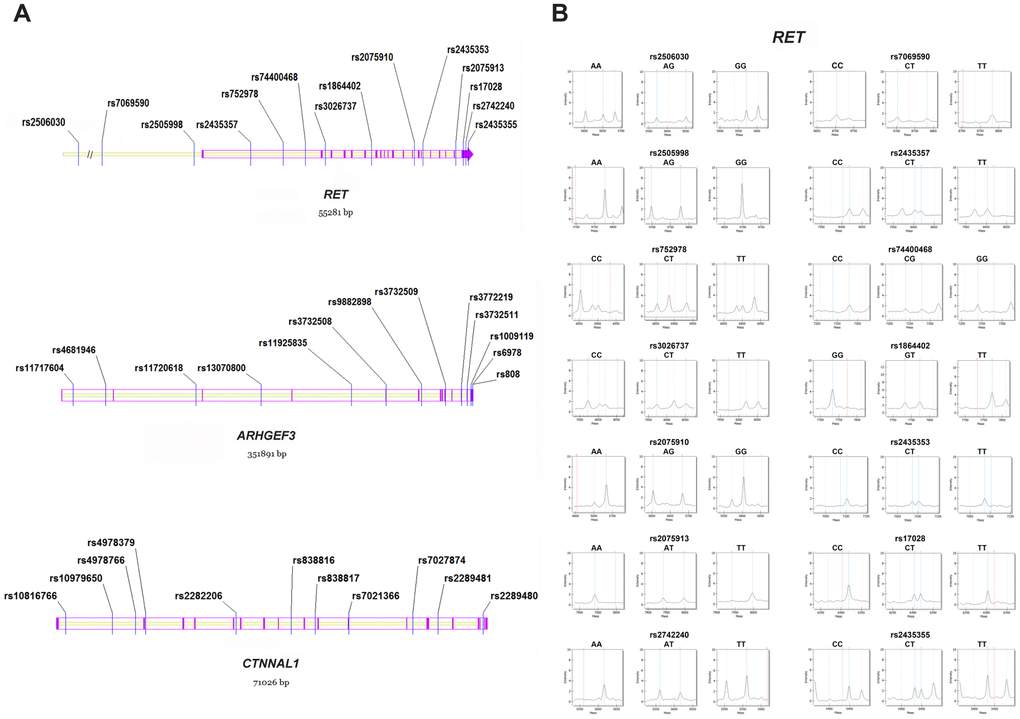
Figure 3. Distribution and representative mass spectra of the genetic markers in the study. (A) The 38 polymorphisms within RET, ARHGEF3 and CTNNAL1. Blue lines denote the studied SNPs; Purple lines and arrows represent the exons in the genomic region; (B) Representative mass spectra of the 14 genetic variants within RET. Blue dotted lines denote the presence of the studied alleles; Red dotted lines indicate no allele detected; Grey dotted lines represent the unrelated peaks. SNP = single nucleotide polymorphism.
SNP-SNP interaction network analysis
In our present study, multifactor dimensionality reduction (MDR) analysis was employed to investigate the SNP-SNP interaction networks in regard to Hirschsprung disease. MDR software (version 3.0.2) was thus used to carry out the MDR analysis, and the risk factors were explored in the best model, which maximized both testing accuracy and cross-validation consistency (CVC) [35]. Specifically, MDR takes advantage of cross-validation by dividing the data into a training dataset (i.e. 9/10 of the data) and a testing dataset (i.e. the remaining 1/10 of the data) to derive estimates of cross-validation consistency and testing accuracy [35]. Moreover, GeneMANIA, a flexible user-friendly database, was used to further interrogate the gene-gene interaction networks and to perform a function prediction, and specifically, the interaction networks derived from GeneMANIA are based on multiple datasets, such as co-expression, genetic interactions and consolidated pathways datasets [36].
Statistical analysis
SHEsis (http://analysis.bio-x.cn/myAnalysis.php) was used to assess Hardy-Weinberg equilibrium (HWE), odds ratio (OR), 95% confidence interval (CI), allelic and genotypic association, and to study linkage disequilibrium (LD), allelic and haplotype distribution [37]. The false discovery rate (FDR) controlling procedure was used to correct the P values of genetic analysis [38]. All P values were two-tailed, and the significance level was set at P = 0.05. G*Power 3 was used to conduct the power calculation [39]. Plink software was employed to carry out the adjustment for age and gender factors in the genetic analysis [40].
Author Contributions
YW, QJ, LL and WC conceived the study. YW, HC and ZX performed the experiments. YW, QJ, LL and WC contributed to data analysis. QJ, WW and BG collected the samples. YW, QJ and AC wrote the manuscript. LL and WC supervised the study. All authors approved the final manuscript.
Acknowledgments
We would like to thank the affected individuals and their family members, and physicians for their contributions to the study over the years.
Conflicts of Interest
The authors declare no conflicts of interest.
Funding
This work was supported by the National Nature Science Foundation of China (81670469, 81630039 and 81771620), Shanghai Municipal Health Commission (201840028), SMC-Chenxing Young Scholar Program of Shanghai Jiao Tong University, Shanghai Key Laboratory of Pediatric Gastroenterology and Nutrituion (17DZ2272000), and Beijing Hospital Administration "Peak Climbing" Talents Development Program (DFL20181301).
References
- 1. Amiel J, Sproat-Emison E, Garcia-Barcelo M, Lantieri F, Burzynski G, Borrego S, Pelet A, Arnold S, Miao X, Griseri P, Brooks AS, Antinolo G, de Pontual L, et al, and Hirschsprung Disease Consortium. Hirschsprung disease, associated syndromes and genetics: a review. J Med Genet. 2008; 45:1–14. https://doi.org/10.1136/jmg.2007.053959 [PubMed]
- 2. Kapoor A, Jiang Q, Chatterjee S, Chakraborty P, Sosa MX, Berrios C, Chakravarti A. Population variation in total genetic risk of Hirschsprung disease from common RET, SEMA3 and NRG1 susceptibility polymorphisms. Hum Mol Genet. 2015; 24:2997–3003. https://doi.org/10.1093/hmg/ddv051 [PubMed]
- 3. Qiu JF, Shi YJ, Hu L, Fang L, Wang HF, Zhang MC. Adult Hirschsprung’s disease: report of four cases. Int J Clin Exp Pathol. 2013; 6:1624–30. [PubMed]
- 4. Vrints I, Costache M, Dobos S, Sondji SH, Fiasse M, Landen S. Hirschsprung’s Disease in Patients of Advanced Age. Int J Gerontol. 2012; 6:54–57. https://doi.org/10.1016/j.ijge.2012.01.003
- 5. Rao M, Gershon MD. The bowel and beyond: the enteric nervous system in neurological disorders. Nat Rev Gastroenterol Hepatol. 2016; 13:517–28. https://doi.org/10.1038/nrgastro.2016.107 [PubMed]
- 6. Badner JA, Sieber WK, Garver KL, Chakravarti A. A genetic study of Hirschsprung disease. Am J Hum Genet. 1990; 46:568–80. [PubMed]
- 7. Moore SW. The contribution of associated congenital anomalies in understanding Hirschsprung’s disease. Pediatr Surg Int. 2006; 22:305–15. https://doi.org/10.1007/s00383-006-1655-2 [PubMed]
- 8. Dang R, Torigoe D, Suzuki S, Kikkawa Y, Moritoh K, Sasaki N, Agui T. Genetic background strongly modifies the severity of symptoms of Hirschsprung disease, but not hearing loss in rats carrying Ednrb(sl) mutations. PLoS One. 2011; 6:e24086. https://doi.org/10.1371/journal.pone.0024086 [PubMed]
- 9. Alves MM, Sribudiani Y, Brouwer RW, Amiel J, Antiñolo G, Borrego S, Ceccherini I, Chakravarti A, Fernández RM, Garcia-Barcelo MM, Griseri P, Lyonnet S, Tam PK, et al. Contribution of rare and common variants determine complex diseases-Hirschsprung disease as a model. Dev Biol. 2013; 382:320–29. https://doi.org/10.1016/j.ydbio.2013.05.019 [PubMed]
- 10. Gui H, Schriemer D, Cheng WW, Chauhan RK, Antiňolo G, Berrios C, Bleda M, Brooks AS, Brouwer RW, Burns AJ, Cherny SS, Dopazo J, Eggen BJ, et al. Whole exome sequencing coupled with unbiased functional analysis reveals new Hirschsprung disease genes. Genome Biol. 2017; 18:48. https://doi.org/10.1186/s13059-017-1174-6 [PubMed]
- 11. Lantieri F, Gimelli S, Viaggi C, Stathaki E, Malacarne M, Santamaria G, Grossi A, Mosconi M, Sloan-Béna F, Prato AP, Coviello D, Ceccherini I. Copy number variations in candidate genomic regions confirm genetic heterogeneity and parental bias in Hirschsprung disease. Orphanet J Rare Dis. 2019; 14:270. https://doi.org/10.1186/s13023-019-1205-3 [PubMed]
- 12. Tang CS, Li P, Lai FP, Fu AX, Lau ST, So MT, Lui KN, Li Z, Zhuang X, Yu M, Liu X, Ngo ND, Miao X, et al. Identification of Genes Associated With Hirschsprung Disease, Based on Whole-Genome Sequence Analysis, and Potential Effects on Enteric Nervous System Development. Gastroenterology. 2018; 155:1908–1922.e5. https://doi.org/10.1053/j.gastro.2018.09.012 [PubMed]
- 13. Tang CS, Zhuang X, Lam WY, Ngan ES, Hsu JS, Michelle YU, Man-Ting SO, Cherny SS, Ngo ND, Sham PC, Tam PK, Garcia-Barcelo MM. Uncovering the genetic lesions underlying the most severe form of Hirschsprung disease by whole-genome sequencing. Eur J Hum Genet. 2018; 26:818–26. https://doi.org/10.1038/s41431-018-0129-z [PubMed]
- 14. Tilghman JM, Ling AY, Turner TN, Sosa MX, Krumm N, Chatterjee S, Kapoor A, Coe BP, Nguyen KH, Gupta N, Gabriel S, Eichler EE, Berrios C, Chakravarti A. Molecular Genetic Anatomy and Risk Profile of Hirschsprung’s Disease. N Engl J Med. 2019; 380:1421–32. https://doi.org/10.1056/NEJMoa1706594 [PubMed]
- 15. Virtanen VB, Salo PP, Cao J, Löf-Granström A, Milani L, Metspalu A, Rintala RJ, Saarenpää-Heikkilä O, Paunio T, Wester T, Nordenskjöld A, Perola M, Pakarinen MP. Noncoding RET variants explain the strong association with Hirschsprung disease in patients without rare coding sequence variant. Eur J Med Genet. 2019; 62:229–34. https://doi.org/10.1016/j.ejmg.2018.07.019 [PubMed]
- 16. Heanue TA, Boesmans W, Bell DM, Kawakami K, Vanden Berghe P, Pachnis V. A Novel Zebrafish ret Heterozygous Model of Hirschsprung Disease Identifies a Functional Role for mapk10 as a Modifier of Enteric Nervous System Phenotype Severity. PLoS Genet. 2016; 12:e1006439. https://doi.org/10.1371/journal.pgen.1006439 [PubMed]
- 17. Heanue TA, Pachnis V. Expression profiling the developing mammalian enteric nervous system identifies marker and candidate Hirschsprung disease genes. Proc Natl Acad Sci USA. 2006; 103:6919–24. https://doi.org/10.1073/pnas.0602152103 [PubMed]
- 18. Gabriel SB, Salomon R, Pelet A, Angrist M, Amiel J, Fornage M, Attié-Bitach T, Olson JM, Hofstra R, Buys C, Steffann J, Munnich A, Lyonnet S, Chakravarti A. Segregation at three loci explains familial and population risk in Hirschsprung disease. Nat Genet. 2002; 31:89–93. https://doi.org/10.1038/ng868 [PubMed]
- 19. Bolk S, Pelet A, Hofstra RM, Angrist M, Salomon R, Croaker D, Buys CH, Lyonnet S, Chakravarti A. A human model for multigenic inheritance: phenotypic expression in Hirschsprung disease requires both the RET gene and a new 9q31 locus. Proc Natl Acad Sci USA. 2000; 97:268–73. https://doi.org/10.1073/pnas.97.1.268 [PubMed]
- 20. Miao X, Garcia-Barceló MM, So MT, Leon TY, Lau DK, Liu TT, Chan EK, Lan LC, Wong KK, Lui VC, Tam PK. Role of RET and PHOX2B gene polymorphisms in risk of Hirschsprung’s disease in Chinese population. Gut. 2007; 56:736. https://doi.org/10.1136/gut.2006.116145 [PubMed]
- 21. Wang Y, Yan W, Wang J, Zhou Y, Chen J, Gu B, Cai W. Common genetic variants in GAL, GAP43 and NRSN1 and interaction networks confer susceptibility to Hirschsprung disease. J Cell Mol Med. 2018; 22:3377–87. https://doi.org/10.1111/jcmm.13612 [PubMed]
- 22. Kwagyan J, Apprey V, Ashktorab H. Linkage disequilibrium and haplotype analysis of COX-2 and risk of colorectal adenoma development. Clin Transl Sci. 2012; 5:60–64. https://doi.org/10.1111/j.1752-8062.2011.00373.x [PubMed]
- 23. Chatterjee S, Kapoor A, Akiyama JA, Auer DR, Lee D, Gabriel S, Berrios C, Pennacchio LA, Chakravarti A. Enhancer Variants Synergistically Drive Dysfunction of a Gene Regulatory Network In Hirschsprung Disease. Cell. 2016; 167:355–368.e10. https://doi.org/10.1016/j.cell.2016.09.005 [PubMed]
- 24. Emison ES, Garcia-Barcelo M, Grice EA, Lantieri F, Amiel J, Burzynski G, Fernandez RM, Hao L, Kashuk C, West K, Miao X, Tam PK, Griseri P, et al. Differential contributions of rare and common, coding and noncoding Ret mutations to multifactorial Hirschsprung disease liability. Am J Hum Genet. 2010; 87:60–74. https://doi.org/10.1016/j.ajhg.2010.06.007 [PubMed]
- 25. Orr N, Chanock S. Common genetic variation and human disease. Adv Genet. 2008; 62:1–32. https://doi.org/10.1016/S0065-2660(08)00601-9 [PubMed]
- 26. Tang CS, Gui H, Kapoor A, Kim JH, Luzón-Toro B, Pelet A, Burzynski G, Lantieri F, So MT, Berrios C, Shin HD, Fernández RM, Le TL, et al. Trans-ethnic meta-analysis of genome-wide association studies for Hirschsprung disease. Hum Mol Genet. 2016; 25:5265–75. https://doi.org/10.1093/hmg/ddw333 [PubMed]
- 27. Hunt R, Sauna ZE, Ambudkar SV, Gottesman MM, Kimchi-Sarfaty C. Silent (synonymous) SNPs: should we care about them? Methods Mol Biol. 2009; 578:23–39. https://doi.org/10.1007/978-1-60327-411-1_2 [PubMed]
- 28. Jaffe AB, Hall A. Rho GTPases: biochemistry and biology. Annu Rev Cell Dev Biol. 2005; 21:247–69. https://doi.org/10.1146/annurev.cellbio.21.020604.150721 [PubMed]
- 29. Liu TH, Zheng F, Cai MY, Guo L, Lin HX, Chen JW, Liao YJ, Kung HF, Zeng YX, Xie D. The putative tumor activator ARHGEF3 promotes nasopharyngeal carcinoma cell pathogenesis by inhibiting cellular apoptosis. Oncotarget. 2016; 7:25836–48. https://doi.org/10.18632/oncotarget.8283 [PubMed]
- 30. Liang CH, Chiu SY, Hsu IL, Wu YY, Tsai YT, Ke JY, Pan SH, Hsu YC, Li KC, Yang PC, Chen YL, Hong TM. α-Catulin drives metastasis by activating ILK and driving an αvβ3 integrin signaling axis. Cancer Res. 2013; 73:428–38. https://doi.org/10.1158/0008-5472.CAN-12-2095 [PubMed]
- 31. Kreiseder B, Orel L, Bujnow C, Buschek S, Pflueger M, Schuett W, Hundsberger H, de Martin R, Wiesner C. α-Catulin downregulates E-cadherin and promotes melanoma progression and invasion. Int J Cancer. 2013; 132:521–30. https://doi.org/10.1002/ijc.27698 [PubMed]
- 32. Clark AG. The role of haplotypes in candidate gene studies. Genet Epidemiol. 2004; 27:321–33. https://doi.org/10.1002/gepi.20025 [PubMed]
- 33. Park B, Nguyen NT, Dutt P, Merdek KD, Bashar M, Sterpetti P, Tosolini A, Testa JR, Toksoz D. Association of Lbc Rho guanine nucleotide exchange factor with alpha-catenin-related protein, alpha-catulin/CTNNAL1, supports serum response factor activation. J Biol Chem. 2002; 277:45361–70. https://doi.org/10.1074/jbc.M202447200 [PubMed]
- 34. Ritchie MD, Hahn LW, Roodi N, Bailey LR, Dupont WD, Parl FF, Moore JH. Multifactor-dimensionality reduction reveals high-order interactions among estrogen-metabolism genes in sporadic breast cancer. Am J Hum Genet. 2001; 69:138–47. https://doi.org/10.1086/321276 [PubMed]
- 35. Hahn LW, Ritchie MD, Moore JH. Multifactor dimensionality reduction software for detecting gene-gene and gene-environment interactions. Bioinformatics. 2003; 19:376–82. https://doi.org/10.1093/bioinformatics/btf869 [PubMed]
- 36. Zuberi K, Franz M, Rodriguez H, Montojo J, Lopes CT, Bader GD, Morris Q. GeneMANIA prediction server 2013 update. Nucleic Acids Res. 2013; 41:W115–22. https://doi.org/10.1093/nar/gkt533 [PubMed]
- 37. Shi YY, He L. SHEsis, a powerful software platform for analyses of linkage disequilibrium, haplotype construction, and genetic association at polymorphism loci. Cell Res. 2005; 15:97–98. https://doi.org/10.1038/sj.cr.7290272 [PubMed]
- 38. Benjamini Y, Drai D, Elmer G, Kafkafi N, Golani I. Controlling the false discovery rate in behavior genetics research. Behav Brain Res. 2001; 125:279–84. https://doi.org/10.1016/S0166-4328(01)00297-2 [PubMed]
- 39. Faul F, Erdfelder E, Lang AG, Buchner A. G*Power 3: a flexible statistical power analysis program for the social, behavioral, and biomedical sciences. Behav Res Methods. 2007; 39:175–91. https://doi.org/10.3758/BF03193146 [PubMed]
- 40. Purcell S, Neale B, Todd-Brown K, Thomas L, Ferreira MA, Bender D, Maller J, Sklar P, de Bakker PI, Daly MJ, Sham PC. PLINK: a tool set for whole-genome association and population-based linkage analyses. Am J Hum Genet. 2007; 81:559–75. https://doi.org/10.1086/519795 [PubMed]