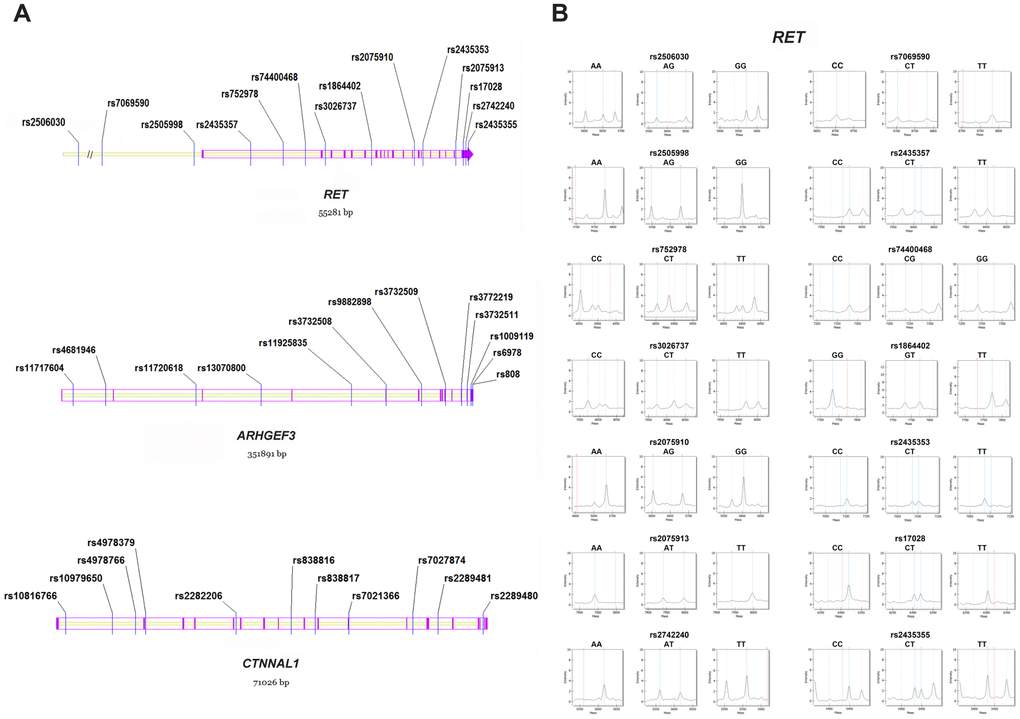
Figure 3.Distribution and representative mass spectra of the genetic markers in the study. (A) The 38 polymorphisms within RET, ARHGEF3 and CTNNAL1. Blue lines denote the studied SNPs; Purple lines and arrows represent the exons in the genomic region; (B) Representative mass spectra of the 14 genetic variants within RET. Blue dotted lines denote the presence of the studied alleles; Red dotted lines indicate no allele detected; Grey dotted lines represent the unrelated peaks. SNP = single nucleotide polymorphism.