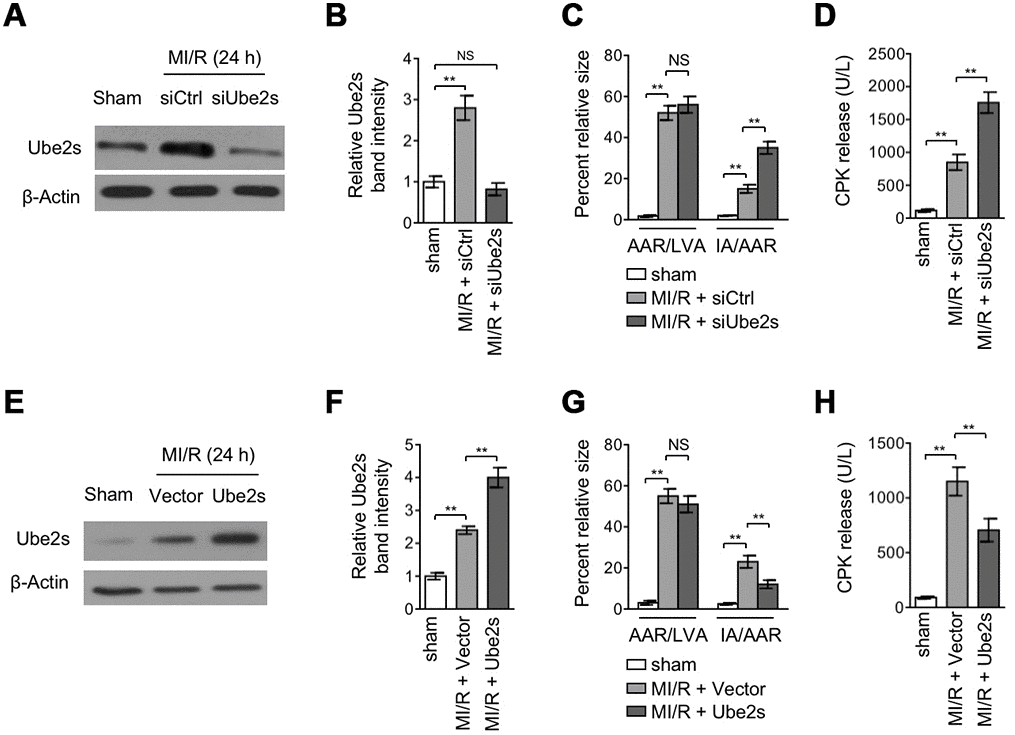
Figure 2.Ube2s acts to protect against MI/R injury. (A–B) C57BL/6 mice were intra-myocardially transfected with control siRNA (siCtrl) or Ube2s siRNA (siUbe2s) 48 h prior to MI/R surgery. Following 24 h of reperfusion, the protein level of Ube2s in the heart was analyzed by Western blotting. Samples from sham group were used as controls. Each group includes 8 mice. β-Actin was used as a loading control. The representative band images (A) and relative band intensity analysis (B) are presented. Data are mean ± SD. Data were compared with sham group using Student’s t-test. **, P < 0.01; NS, not significant. (C) Heart samples were harvested as described in (A), and the mid-myocardial cross sections were prepared. The infarct size in the heart sections was quantified, and the results of percentage of size are shown. AAR/LVA, ratio of area at risk (AAR) to left ventricular area (LVA); IA/AAR, ratio of infarct area (IA) to AAR. Data are mean ± SD. Data were compared using Student’s t-test. **, P < 0.01; NS, not significant. (D) C57BL/6 mice were treated as in (A). The samples of serum were collected and the level of creatine phosphokinase (CPK) was quantified. Data are mean ± SD. Data were compared using Student’s t-test. **, P < 0.01. (E, F) C57BL/6 mice were intra-myocardially infected with lentivirus expressing vector control or Ube2s 48 h prior to MI/R surgery. Following 24 h of reperfusion, the protein level of Ube2s in the heart was analyzed by Western blotting. Samples from sham group were used as controls. Each group includes 8 mice. β-Actin was used as a loading control. The representative band images (E) and relative band intensity analysis (F) are presented. Data are mean ± SD. Data were compared using Student’s t-test. **, P < 0.01. (G) Heart samples were harvested as described in (E), and the mid-myocardial cross sections were prepared. The infarct size in the heart sections was quantified, and the results of percentage of size are shown. AAR/LVA, ratio of area at risk (AAR) to left ventricular area (LVA); IA/AAR, ratio of infarct area (IA) to AAR. Data are mean ± SD. Data were compared using Student’s t-test. **, P < 0.01; NS, not significant. (H) C57BL/6 mice were treated as in (E). The samples of serum were collected and the level of creatine phosphokinase (CPK) was quantified. Data are mean ± SD. Data were compared using Student’s t-test. **, P < 0.01.