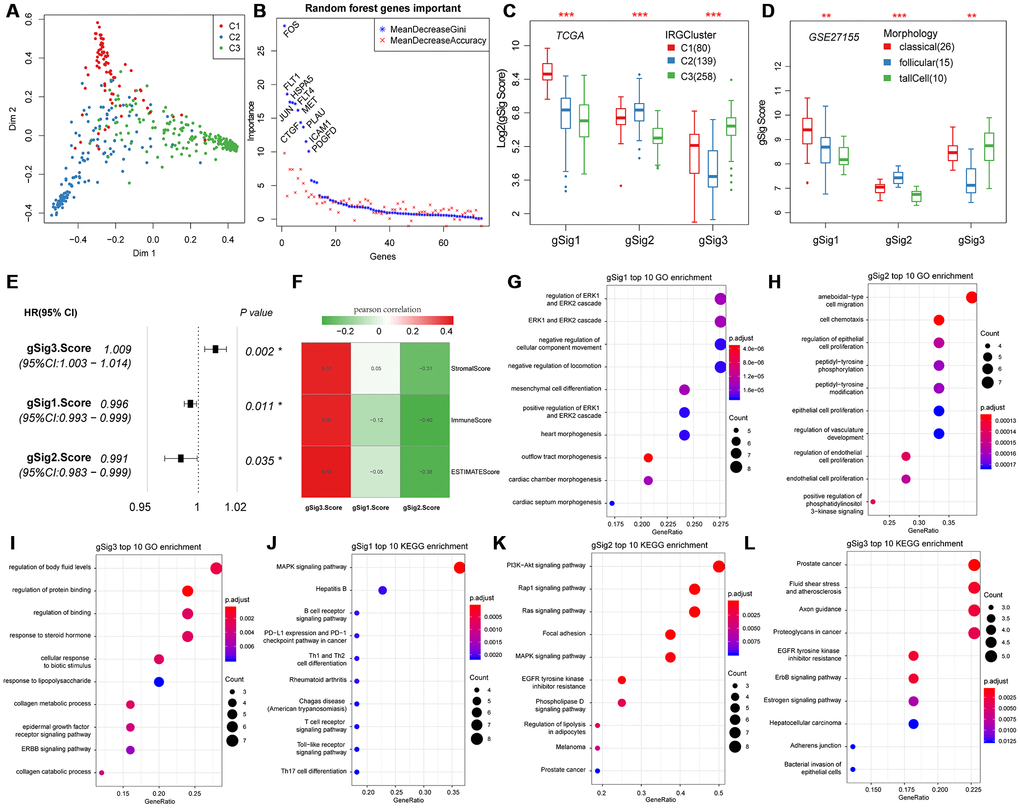
Figure 2.Expression characteristics and functional annotation of the immune gene modules in each subtype. (A) First and second principal component scores for each sample. (B) The importance ranking of 74 genes in random forest. (C) Distribution of gSigs score in IRGCluster. (D) Distribution of gSigs score in different pathological subtypes of GSE27155 data set. (E) The prognosis relationship between gSigs score and DFS. (F) Heat map showing gSig score and Pearson correlation results of immune infiltration. (G–I) GO enrichment analysis results of gSig1, gSig2 and gSig3. (J–L) KEGG pathway enrichment analysis results of gSig1, gSig2 and gSig3. Dot plot shows the top 10 GO and KEGG pathway enrichment results. The color in the graph indicates significance, and the dot size indicates the number of genes.