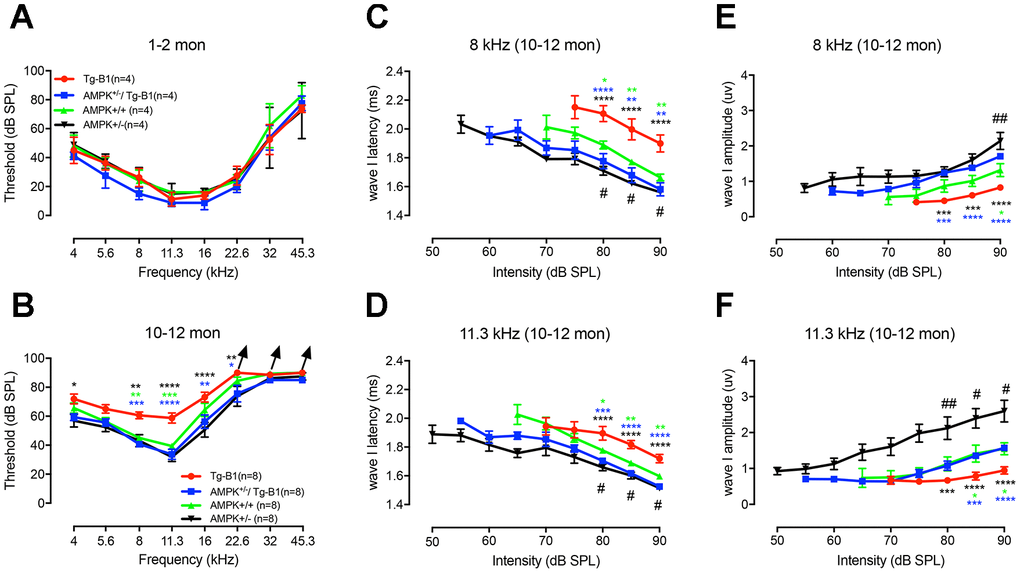
Figure 1.General ABR findings reveal the protective effect of AMPK KO. Auditory thresholds were evaluated by ABRs at age of 1-2 months (A) and 10-12 months (B) for four genotype groups. There is no significant difference in ABR thresholds for all four genotypes at 1-2 months (F(3,12)=2.972, p=0.0744, two-way ANOVA followed by Bonferroni post-test), while at 10-12 months of age, around 20dB threshold elevation was observed in Tg-B1 mice (red) at 8 kHz (Tg-B1 vs. WT, F(1,14)=28.974, p<0.001), 11.3 kHz (Tg-B1 vs. WT, F(1,14)=21.912, p<0.001, one-way ANOVA followed by Bonferroni post-test) compared to age-matched WT controls (green), and a moderate increase of thresholds at low frequencies. Age-matched AMPK+/−/Tg-B1 mice (blue) showed significantly lower ABR thresholds compared to Tg-B1 mice at 10-12 month, for 8 kHz (Tg-B1 vs. AMPK+/−/Tg-B1, F(1,14) =50.479, p<0.001), 11.3 kHz (F(1,14)=25.455, p<0.001) and 16 kHz (F(1,14)=8.463, p=0.011, one-way ANOVA followed by Bonferroni post-test) and showed similar ABR thresholds to wild type controls (AMPK+/−/Tg-B1 vs. WT, F(5,84)=0.3781, p=0.8625, two-way ANOVA followed by Bonferroni post-test). However, there were no significant differences in ABR thresholds among AMPK+/−/Tg-B1 (blue), wild type controls (green) and AMPK+/− (black) groups (F(10,126)=0.392, p=0.9482, two-way ANOVA followed by Bonferroni post-test). Arrowhead points excluded mice that showed no response at 90 dB SPL, the upper limit of the ABR recording. Number of mice with “no response” at 90 dB SPL: Tg-B1 mice at 22.6 kHz, n=2, 32 kHz, n=2, 45.3 kHz, n=3; AMPK+/−/Tg-B1 mice at 22.6 kHz, n=0, 32 kHz, n=1, 45.3 kHz, n=3; WT mice at 22.6 kHz, n=0, 32 kHz, n=1, 45.3 kHz, n=4 and AMPK+/− mice at 22.6 kHz, n=0, 32 kHz, n=0, 45.3 kHz, n=3. (C–F) Amplitudes and latencies of ABR wave I in different genotype groups aged 10-12 months from 50-90 dB SPL (8 and 11.3 kHz) were computed from sorted ABR wave traces. In contrast to the AMPK+/−/Tg-B1 and wild type mice, latencies of ABR wave I are remarkably prolonged in Tg-B1 mice at 8 kHz (Tg-B1 vs. WT, F(1,14)=11.7, p=0.0041; Tg-B1 vs. AMPK+/−/Tg-B1, F(1,14)=15.71, p=0.0014; AMPK+/−vs. WT, F(1,14)=19.84, p=0.0005, Figure 1C) and 11.3 kHz (Tg-B1 vs. WT, F(1,14)=14.91, p=0.0017; Tg-B1 vs. AMPK+/−/Tg-B1, F(1,14)=40.26, p<0.0001; AMPK+/−vs. WT, F(1,14)=8.752, p=0.0104, two-way ANOVA followed by Bonferroni post-test, Figure 1D). Besides, significantly decreased amplitude of peak I was noticed in Tg-B1 mice at 8 kHz (F(1,14)=6.091, p=0.0271, Figure 1E) and 11.3 kHz (F(1,14)=7.792, p=0.0144, two-way ANOVA followed by Bonferroni post-test, Figure 1F) as compared to wild type controls. Significant increases of ABR wave I amplitude in AMPK+/−/Tg-B1 mice at both 8 kHz (F(1,14)=63.76, p<0.0001) and 11.3 kHz (F(1,14)=27.82, p=0.0001, two-way ANOVA followed by Bonferroni post-test) were also observed as compared to Tg-B1 mice. Briefly, AMPK+/−/Tg-B1 mice exhibited significantly increased wave I amplitudes (E, F) and shorter wave I latencies (C, D) as compared to those in Tg-B1 mice. Furthermore, AMPK+/− mice (black) showed increased wave I amplitudes as compared to wild type mice (green) at both 8 kHz (F(1,14)=7.653, p=0.0151) and 11.3 kHz (F(1,14)=8.656, p=0.0107, two-way ANOVA followed by Bonferroni post-test), as marked with a pound sign (#). The bar graph represents the mean threshold/wave I amplitude or latency ± SEM (n=8). Asterisks symbolized statistically significant differences at the indicated frequencies and sound intensities.
Figure 1 — Down-regulation of AMPK signaling pathway rescues hearing loss in TFB1 transgenic mice and delays age-related hearing loss | Aging