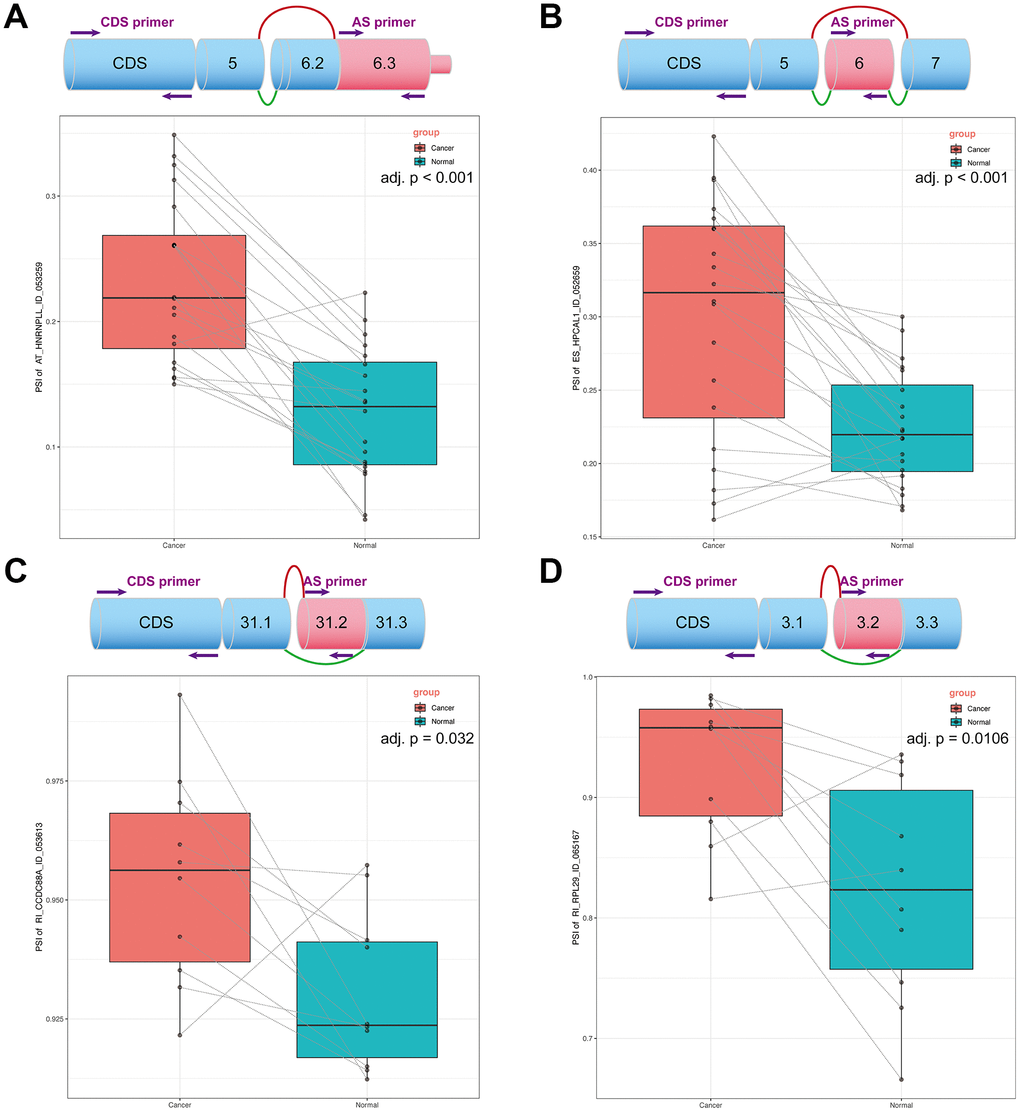
Figure 8.OS-related DEAS events expression in NSCLC. (A) The top plot demonstrated the splicing pattern of AT〇HNRNPLL〇ID〇053259. The bottom plot displays the PSI of AT〇HNRNPLL in cancer and normal tissues. (B) The top plot demonstrated the splicing pattern of ES〇HPCAL1〇ID〇052659. The bottom plot displays the PSI of ES〇HPCAL1 in cancer and normal tissues. (C) The top plot demonstrated the splicing pattern of RI〇CCDC88A〇ID〇053613. The bottom plot displays the PSI of RI〇CCDC88A in cancer and normal tissues. (D) The top plot demonstrated the splicing pattern of RI〇RPL29〇ID〇065167. The bottom plot displays the PSI of RI〇RPL29 in cancer and normal tissues. In the schematic diagram, green lines represent transcripts before splicing and the red lines represent transcripts after splicing.