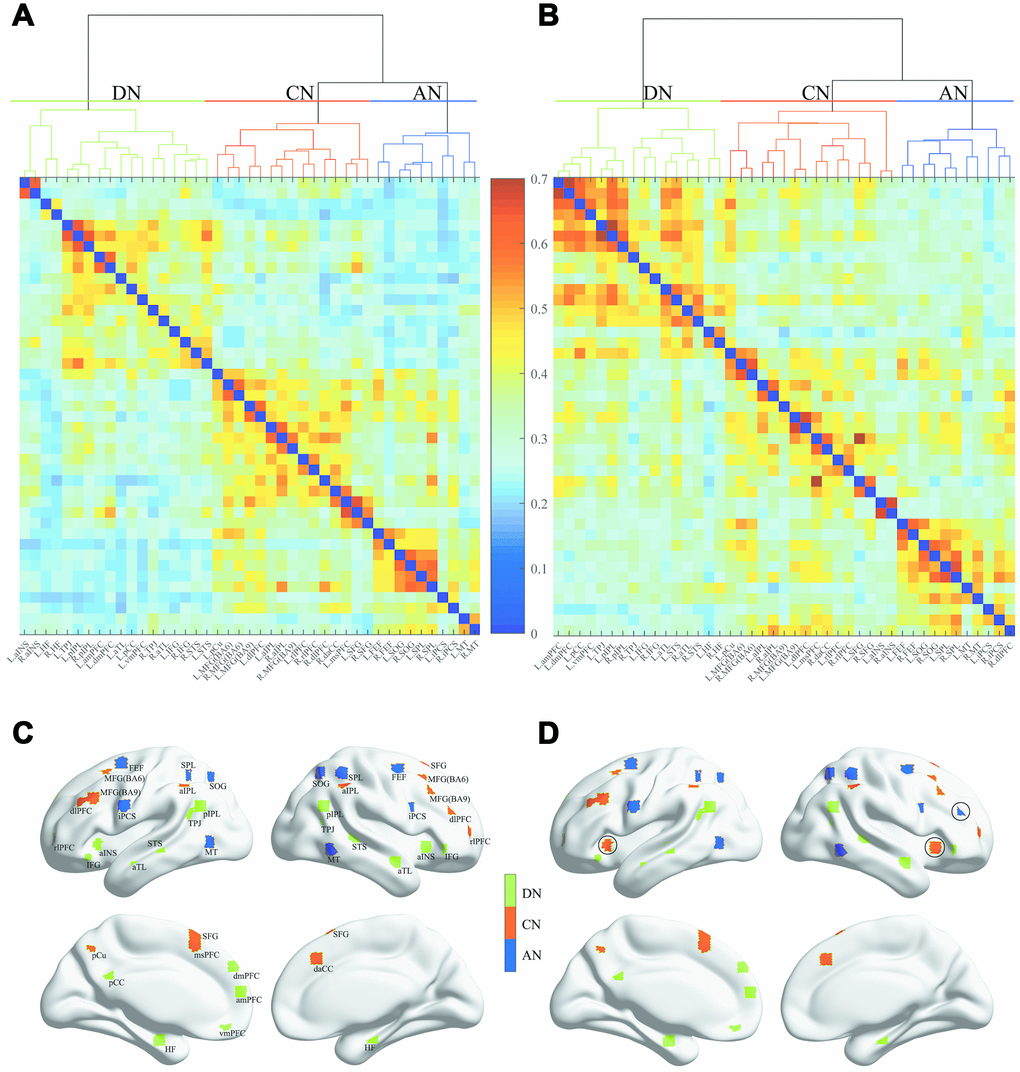
Figure 1.Dendrogram of the hierarchical cluster analysis of the correlations and spatial distribution of the three networks. (A) and (B) separately represent the NC group and aMCI group, and the colors indicate the magnitude of correlation. (C) and (D) separately represent the NC group and aMCI group. The green, red and blue regions indicate the DN, CN and AN, respectively.