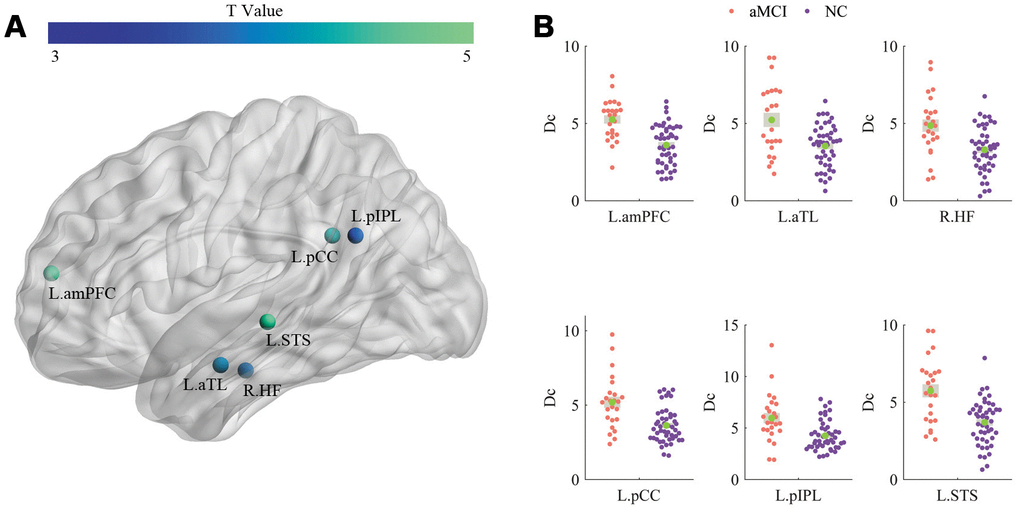
Figure 4.Comparisons of Dc. (A) and (B) illustrate the T values and significant alterations (Bonferroni corrected) between the two groups, respectively.
Figure 4 — Increased intrinsic default-mode network activity as a compensatory mechanism in aMCI: a resting-state functional connectivity MRI study | Aging