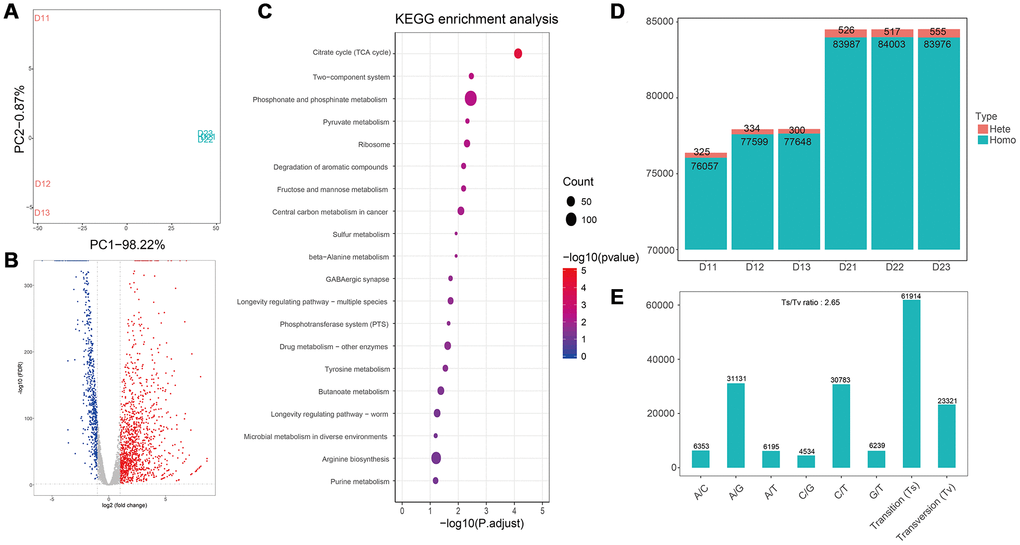
Figure 3.Transcriptome analyses of E. coli after treatment with flavonoids in A. conyzoides. (A) PCA plot for E. coli with or without the treatment of flavonoids in A.conyzoides. (B) Volcano Plot of expression of genes in E. coli after treatment with flavonoids in A. conyzoides. The horizontal coordinate represents the log2 value taking from the fold changes of gene expression, and the vertical coordinate represents the p-value with -log10 transformed. The red, blue and gray dots represent up-regulation, down-regulation and none difference, respectively. (C) KEGG enrichment analysis of E. coli after treatment with flavonoids in A. conyzoides with top 20 pathways presented. The horizontal coordinate represents the Rich Factor, and the vertical coordinate represents the KEGG Pathway entry. The size of the dot in the graph indicates the number of differential genes annotated to the pathways, and the color shade represents the significant FDR value of the pathways. The graph only displays the twenty most significantly altered pathways. (D, E) Quantity statistics of the SNPs and the Transition/Transversion of genotype in E. coli after treatment with flavonoids in A. conyzoides.