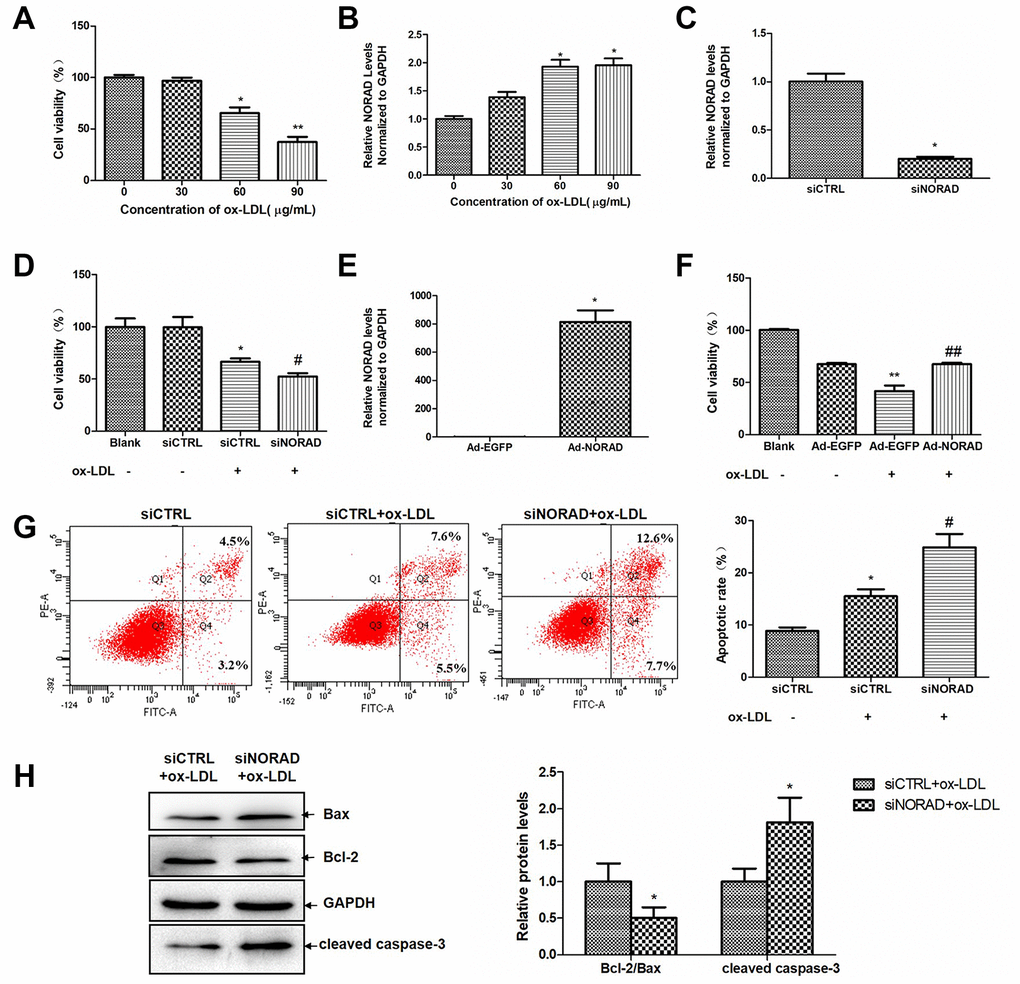
Figure 1.NORAD-knockdown aggravates ox-LDL-induced viability reduction and apoptosis of HUVECs. (A) Dose-dependent effect of ox-LDL on cell viability in HUVECs. Cell viability was measured after HUVECs were treated with 0-90 μg/mL of ox-LDL for 24 h by the CCK-8 assay. The data in each group were normalized with the group treated with 0 μg/mL ox-LDL. (n = 6, *P < 0.05 and ##P < 0.01 vs. group treated with 0 μg/mL ox-LDL, respectively). (B) Dose-dependent upregulation of NORAD expression in HUVECs treated with 0-90 μg/mL of ox-LDL for 24 h (n = 3, *P < 0.05 vs. group treatment with 0 μg/mL ox-LDL). (C) HUVECs were transfected with siNORAD or scrambled siCTRL. NORAD levels were analyzed through qRT-PCR (n = 3, *P < 0.05 vs. siCTRL). (D) NORAD-knockdown suppressed the viability of ox-LDL-treated HUVECs. The effect of siNORAD on the cell viability was measured via a CCK-8 assay. Cells treated without both siRNA and ox-LDL were used as blank control. (n = 3, *P < 0.05 vs. siCTRL, #P < 0.05 vs. siCTRL+ox-LDL). The data of each group were normalized to the blank groups. (E) HUVECs were infected with Ad-NORAD or Ad-EGFP. NORAD levels were analyzed through qRT-PCR (n = 3, *P < 0.05 vs. Ad-EGFP). (F) The effect of NORAD overexpression on the cell viability was measured via a CCK-8 assay. Cells treated without both adenovirus and ox-LDL were used as blank control. (n = 6, **P < 0.01 vs. Ad-EGFP, ##P < 0.01 vs. Ad-EGFP+ox-LDL). The data of each group were normalized to the blank groups. (G) NORAD- knockdown increased ox-LDL-induced cell apoptosis. The apoptosis rate was detected through flow cytometry by using annexin V-FITC/PI double staining. The apoptotic rate was analyzed in terms of the percentage of the lower and upper right quadrants (n = 3, *P < 0.05 vs. siCTRL, #P < 0.05 vs. siCTRL+ox-LDL). (H) Western blot was used to analyze the expression levels of Bcl-2, Bax and cleaved caspase-3. The results were analyzed with Image J. Values were shown as mean ± SD (n = 3). *P < 0.05 vs. siCTRL+ox-LDL.