Submit an Article
Navigate
Home
Editorial Board
Editorial Policies
Current Volume
Archive
Scientific Integrity
Publication Ethics Statements
Interviews with Outstanding Authors
Newsroom
Sponsored Conferences
Podcast
Contact
Special Collections
Submit an Article
Online ISSN: 1945-4589
Research Paper
|
Volume 12, Issue 8
|
pp. 7163–7182
Association of common variation in
ADD3
and
GPC1
with biliary atresia susceptibility
Back to article
Figure 4
(4 of 5)
−
100%
+
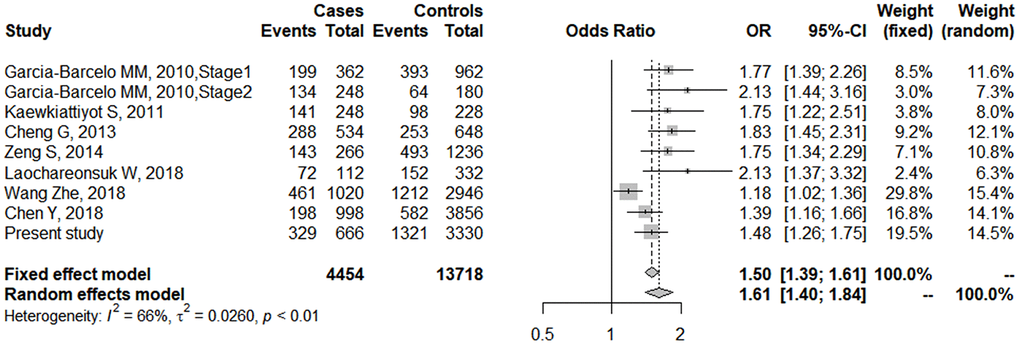
Figure 4.
Forest plot of meta-analysis for rs17095355 association with BA risk.
The sizes of the squares are proportional to study weights. Diamond markers indicated pooled effect sizes.