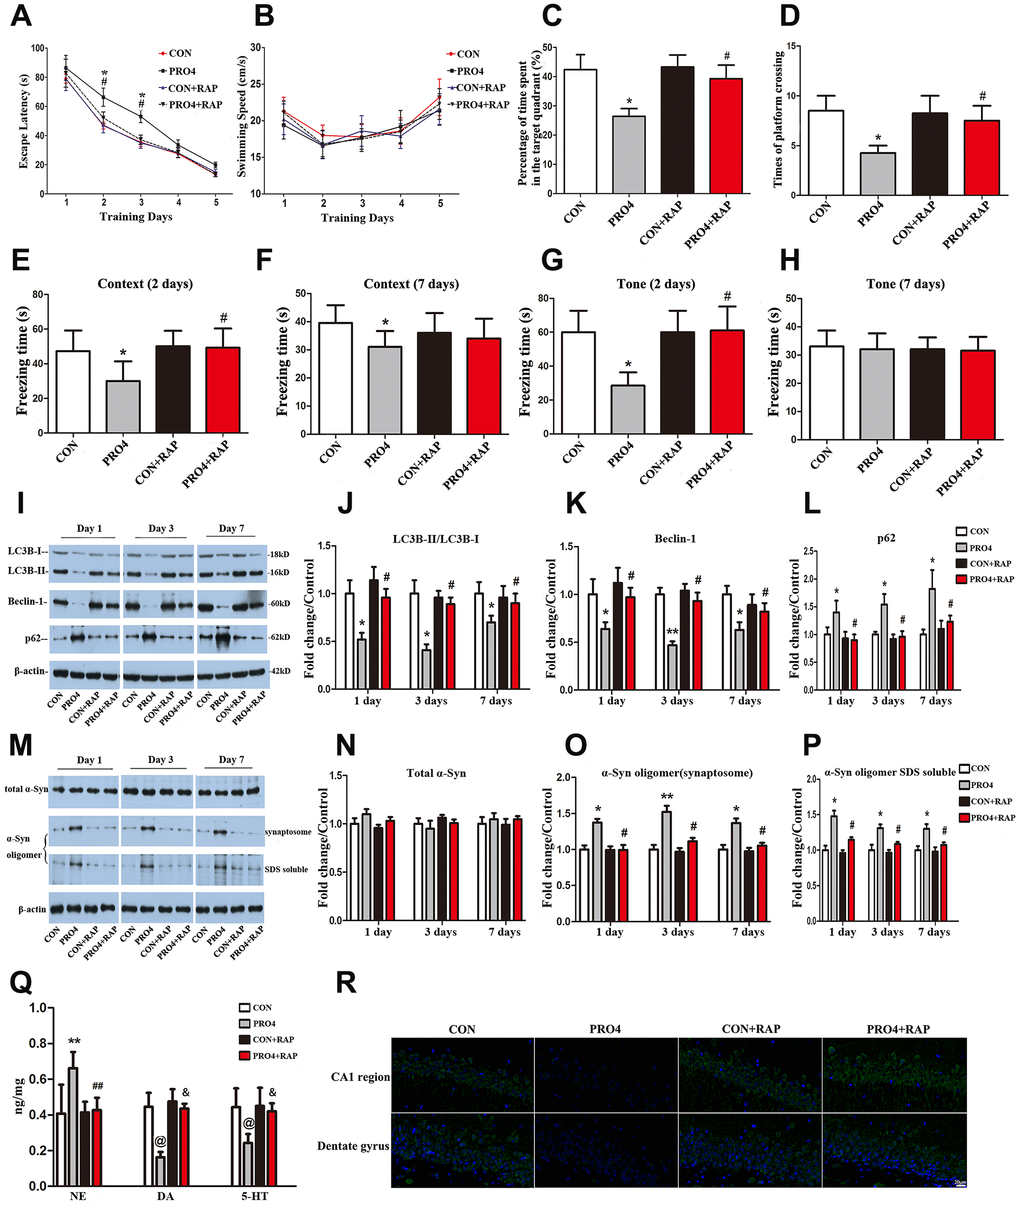
Figure 3.The effects of an autophagy agonist on propofol-induced changes in behavior, autophagy-related protein levels and α-synuclein levels in the hippocampus in aged rats. (A) Rapamycin (RAP) reversed the propofol anesthesia (4 h)-induced increase in escape latency. (B) Propofol anesthesia (4 h) and/or rapamycin did not alter the swimming speed. (C, D) Rapamycin reversed the propofol anesthesia (4 h)-induced decreases in the target quadrant dwelling time and the number of platform crossings. (E, F) Rapamycin ameliorated the propofol anesthesia (4 h)-induced decrease in the freezing time in the context test 2 and 7 days after anesthesia. (G, H) Rapamycin ameliorated the propofol anesthesia (4 h)-induced decrease in the freezing time in the tone test 2 and 7 days after anesthesia. (I) Representative immunoblots illustrating the effects of rapamycin on the propofol anesthesia (4 h)-induced changes in hippocampal autophagy-related protein levels. (J) Rapamycin reversed the propofol anesthesia (4 h)-induced decrease in LC3B expression in the hippocampus. (K) Rapamycin reversed the propofol anesthesia (4 h)-induced decrease in Beclin-1 expression in the hippocampus. (L) Rapamycin reversed the propofol anesthesia (4 h)-induced increase in p62 expression in the hippocampus. (M) Representative immunoblots illustrating the effects of rapamycin on the propofol anesthesia (4 h)-induced changes in α-synuclein (α-Syn) levels in the hippocampus. (N) Rapamycin did not alter total α-synuclein levels. (O, P) Rapamycin reversed the propofol anesthesia (4 h)-induced increases in α-synuclein oligomer levels in synaptosomes and SDS-solubilized fractions in the hippocampus. (Q) Rapamycin reversed the propofol anesthesia (4 h)-induced changes in neurotransmitter levels in the hippocampus. (R) Representative confocal staining of LC3B expression in the CA1 and DG regions of the hippocampus in the four groups of rats 7 days after propofol anesthesia. Values are expressed as the mean ± SEM (n = 10 per group for behavioral tests, n = 8 per group for neurotransmitter detection, n = 6 per group for Western blot analysis, n = 4 per group for confocal analysis of LC3B staining). *p < 0.05, **p < 0.01, @p < 0.001 PRO4 vs. CON group. #p < 0.05, ##p < 0.01, &p < 0.001 PRO4 + RAP group vs. PRO4 group. CON: the control group, CON + RAP: the control + rapamycin group, PRO4: the 4-h propofol anesthesia group, PRO4 + RAP: the 4-h propofol anesthesia + rapamycin group. Scale bar, 20 μm (R).