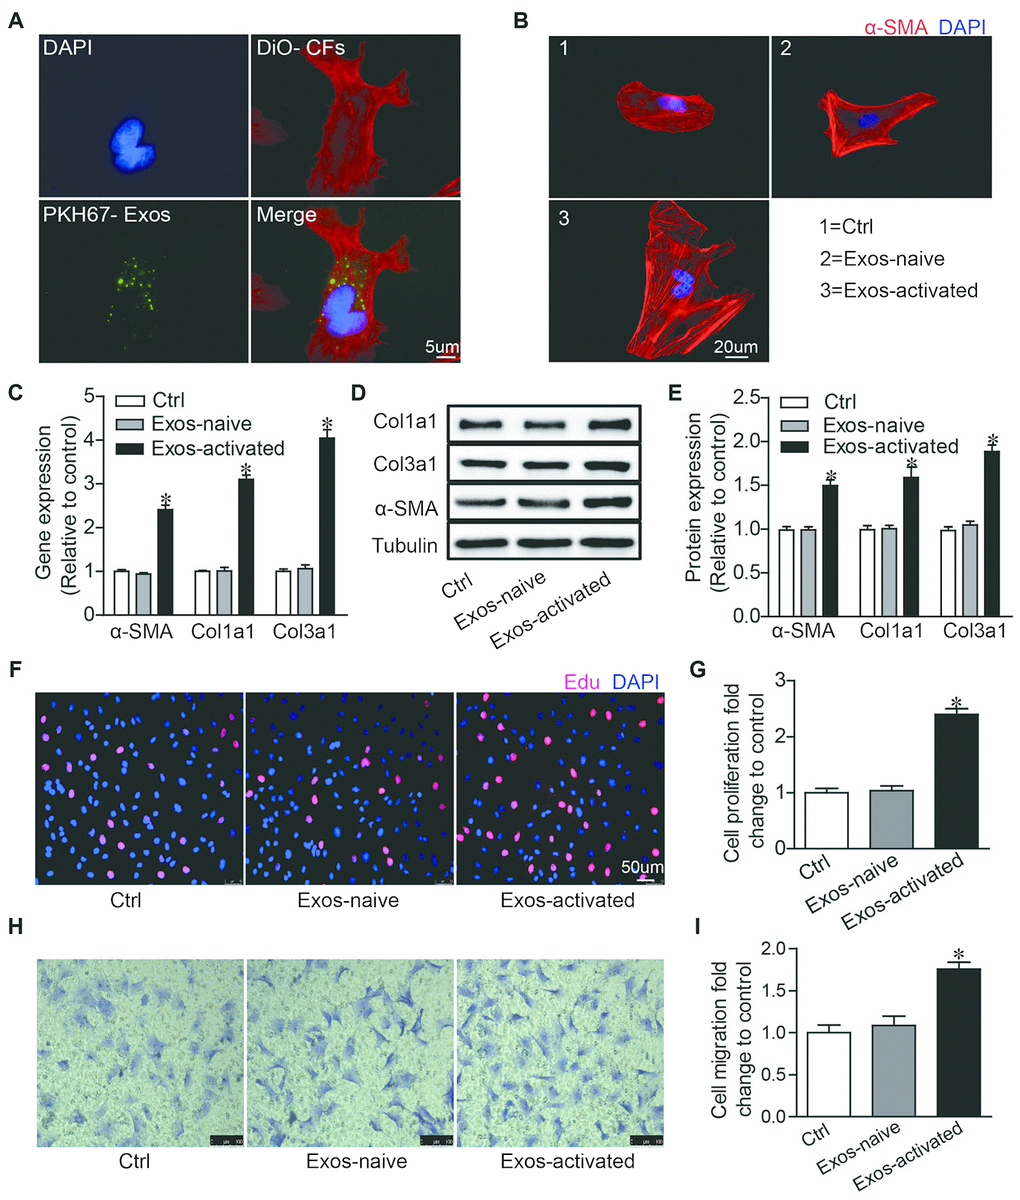
Figure 2.Activated CD4+ T cells-derived exosomes promote cardiac fibroblasts activation in vitro. (A) Immunofluorescence imaging analysis PKH67-labeled exosomes were taken up by cardiac fibroblasts. Green: exosomes; Red: cardiac fibroblasts; Blue: DAPI. The images shown are representative of three independent experiments. Scale bar = 5 μm. (B) Immunofluorescent analysis of myofibroblast activation. Red signals indicated α-SMA protein expression, and blue signals for nuclei. The images shown are representative of three independent experiments. Scale bar = 20 μm. Ctrl: control. Exos-naive: exosomes derived from naive CD4+ cells. Exos-activated: exosomes derived from activated CD4+ cells. (C) qPCR analysis of α-SMA, Col1α1 and Col3α1 levels in cardiac fibroblasts incubated with activated CD4+ T cells-derived exosomes for 48h. n = 3 per group. The blots shown are representative of three independent experiments. *P < .05 vs Exos-naive. (D) Expression levels of α-SMA, Col1a1 and Col3a1 were detected by western blot analysis. (E) Quantitative analysis of proteins expression using Image J software. *P < .05 vs Exos-naive. (F) EdU incorporation detection of cardiac fibroblast proliferation. The images shown are representative of three independent experiments. Scale bar = 50 μm. (G) Quantification analysis of cell proliferation using EdU assay data. *P < .05 vs Exos-naive. (H) Transwell assay of cardiac fibroblast migration. The images shown are representative of three independent experiments. Scale bar = 100 μm. (I) Quantification analysis of cell migration using transwell assay data. *P < .05 vs Exos-naive.