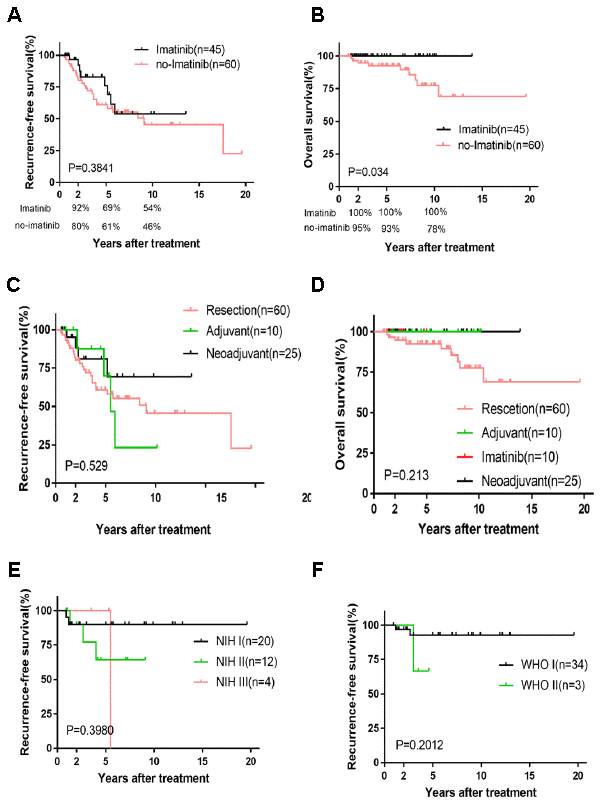
Figure 1.Kaplan-Meier survival plot of RFS and OS based on imatinib and four treatments and the survival curve of RFS based on relatively lower risk. RFS and OS of imatinib and no-imatinib (A, B); RFS and OS of four treatments (C, D); RFS of NIH I, II, III and WHO I, II (E, F).