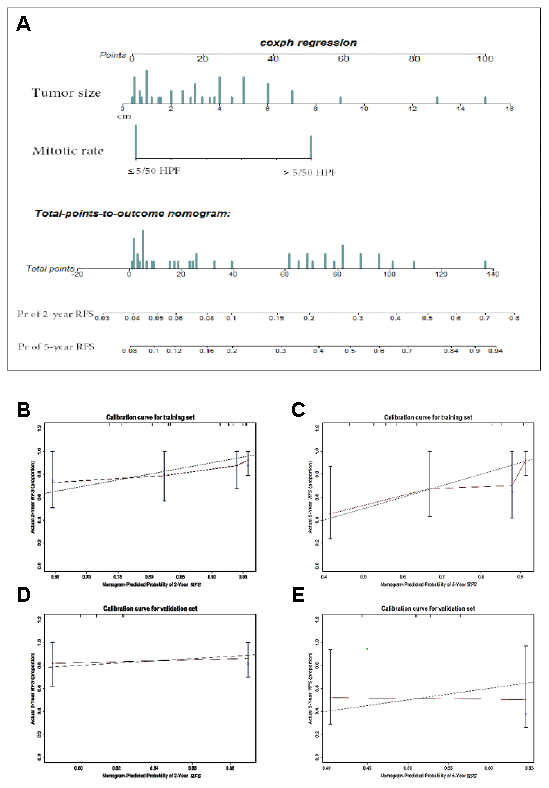
Figure 2.Nomogram and validation to predict the probabilities of 2-year and 5-year recurrence-free survival. To use the nomogram (A), an individual patient’s value is located on each variable axis, and a line is drawn upward to determine the number of points received for each variable value. The sum of these points is located on the Total points axis, and a line is drawn downward to the survival axes to determine the likelihood of 2- or 5-year RFS. Tumor size(cm), mitotic rate (≤5 or >5 mitoses per 50 HPFs). The calibration curve for predicting patient survival at (B) 2 years and (C) 5 years in the training set and at (D) 2 years and (E) 5 years in the validation set. Nomogram-predicted probability of RFS is plotted on the x-axis; actual RFS is plotted on the y-axis.