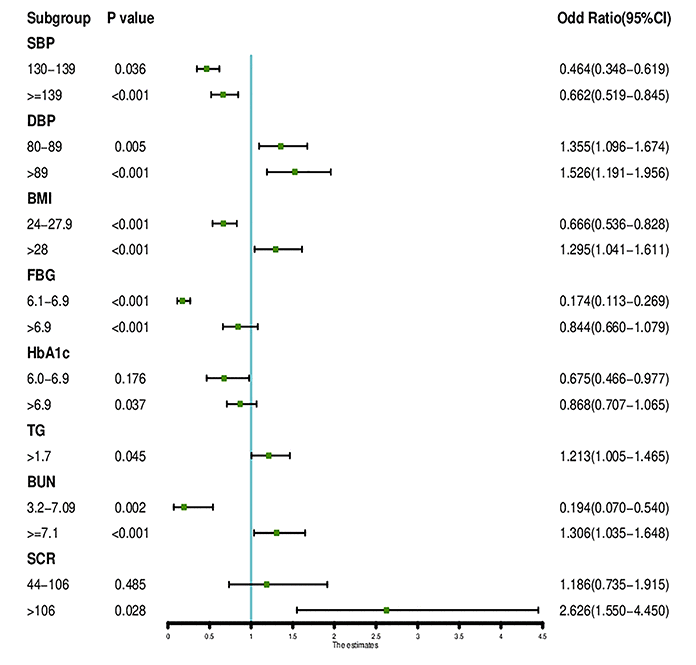
Figure 2.The forest plot of the OR of the selected feature. Use of forest plot for outcome in LASSO regression model and logistic regression analysis.
Figure 2 — Nomogram for the prediction of diabetic nephropathy risk among patients with type 2 diabetes mellitus based on a questionnaire and biochemical indicators: a retrospective study | Aging