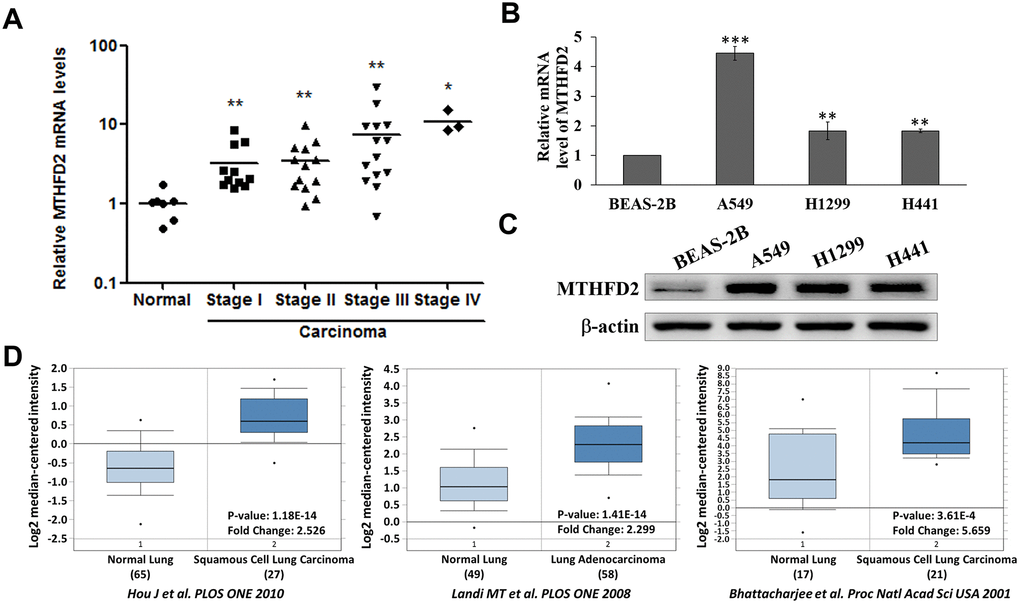
Figure 1.Levels of MTHFD2 in lung cancer tissues and cell lines. (A) Relative MTHFD2 gene expression of normal lung tissues and the different stages of lung cancer tissues. * and ** indicate p<0.05 and p<0.01, respectively using paired t-test, compared to normal group. (B) Relative MTHFD2 gene expression of normal lung cell line BEAS-2B and lung cancer cell lines A549, H1299 and H441. ** and *** indicate p<0.01 and p<0.001, respectively using one-way ANOVA, compared to normal cell line BEAS-2B. (C) Representative MTHFD2 protein expression in normal and lung cancer cell lines, where β-actin was loaded as relative control (D) Online Oncomine database-dependent (https://www.oncomine.org/) in silico analysis of fold changes in MTHFD2 expression in lung cancer tissues. MTHFD2 mRNA expression in normal and malignant lung specimens are presented as box and whisker plots. Sample numbers, fold changes, and p-value for MTHFD2 expression between normal and malignant specimens are indicated. Data are expressed as mean ± SD.
Figure 1 — Modulating redox homeostasis and cellular reprogramming through inhibited methylenetetrahydrofolate dehydrogenase 2 enzymatic activities in lung cancer | Aging