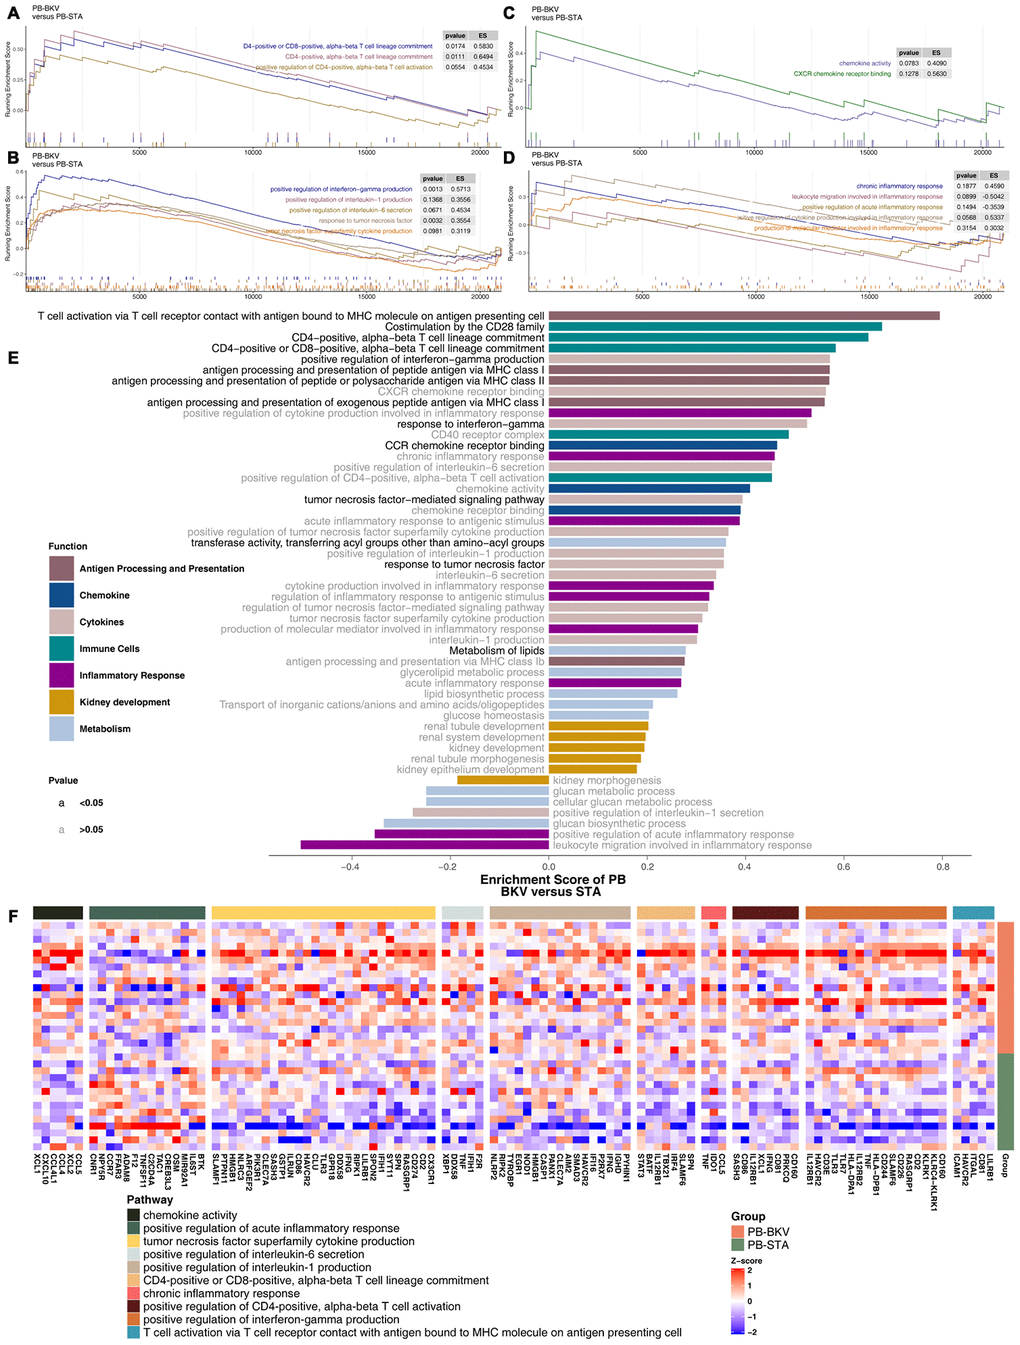
Figure 6.GSEA of hallmark gene sets in PB-BKV and PB-STA data downloaded from MSigDB (GSE47199 and GSE75693). GSEA results for immune cell- (A), cytokine- (B), chemokine- (C) and inflammation-related pathways (D). All transcripts were ranked by the log2(fold change) between PB-BKV and PB-STA. Each run was performed with 1,000 permutations. (E) Differences in pathway activities scored by GSEA between PB-BKV and PB-STA. Enrichment results with significant differences between PB-BKV and PB-STA are shown. The functions of the pathways are shown in the annotations. The black font indicates P < 0.05. The gray font indicates P > 0.05. (F) Heatmap of core genes in enriched pathways (the same as those in Figure 4K, 4L) between PB-BKV and PB-STA.