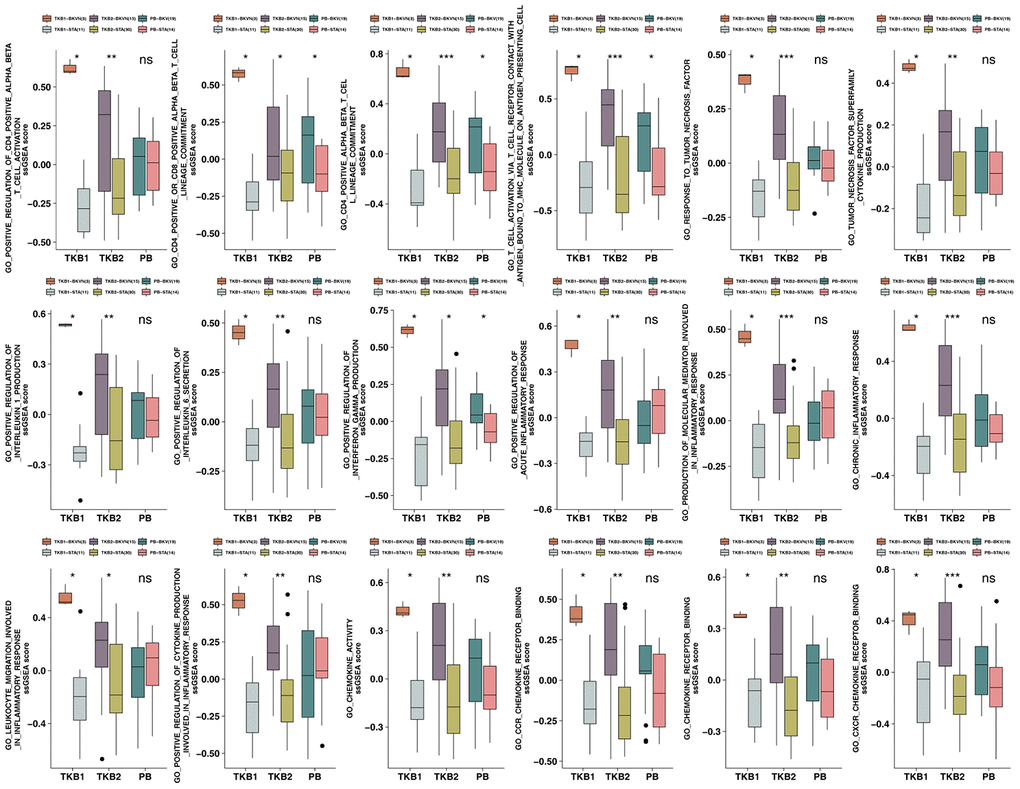
Figure 7.ssGSEA scores for the PB (STA and BKV), TKB1 (STA and BKVN) and TKB2 (STA and BKVN) datasets. The thick line represents the median value. The bottom and top of the boxes indicate the 25th and 75th percentiles (interquartile range). The whiskers encompass 1.5 times the interquartile range. *, P< 0.05; **, P< 0.01; ***, P< 0.001; and ****, P<0.0001; Mann-Whitney U test.