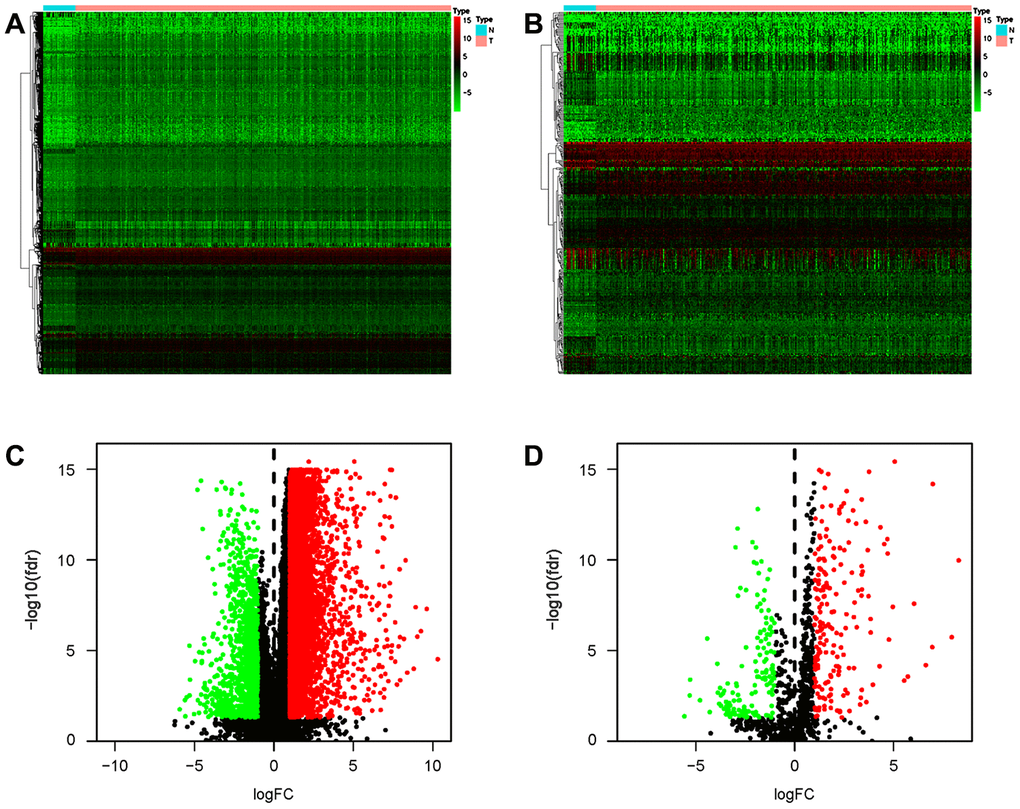
Figure 6.Differentially expressed IRGs in the gastric cancer cohort. Heatmap of DEGs (A) and differentially expressed IRGs (B). Volcano plot of DEGs (C) and differentially expressed IRGs (D). Blue and red dots represent DEGs, and black dots represent genes that were not differentially expressed.