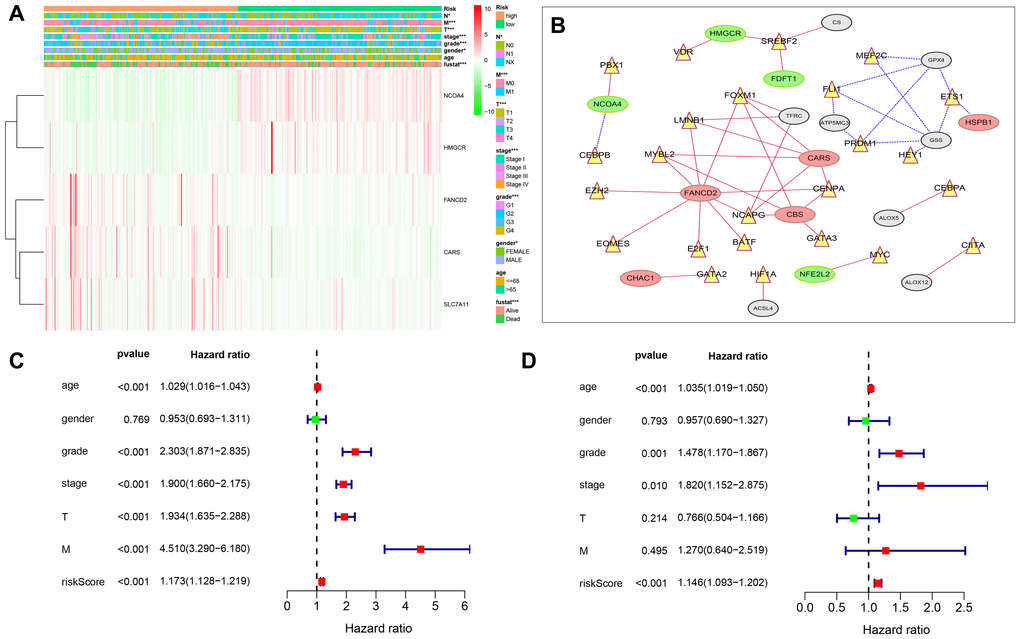
Figure 6.Relationship between the risk score, clinicopathological features. (A) The heatmap shows the profiles of the expression of survival model FRGs and clinicopathological features in low- and high-risk ccRCC patients. (B) Diagrammatic representation shows the regulatory relationship between transcription factors and FRGs. The red lines represent positive regulation, the blue lines represent reverse regulation, the yellow triangle represents transcription factors, the red oval represents up-regulated FRGs, the green oval represents down-regulated FRGs, and gray represents statistically insignificant ERGs. (C) Univariate Cox regression analyses results show the association between clinicopathological parameters such as age, gender, grade, tumor size (T), tumor node (N), tumor metastasis (M), and risk score of the new survival model with the OS of ccRCC patients. (D) Multivariate Cox regression analyses results show the association between clinicopathological parameters such as age, gender, grade, tumor size (T), tumor node (N), tumor metastasis (M), and risk score of the new survival model with the OS of ccRCC patients. *P < 0.05, **P < 0.01, and ***P < 0.001.