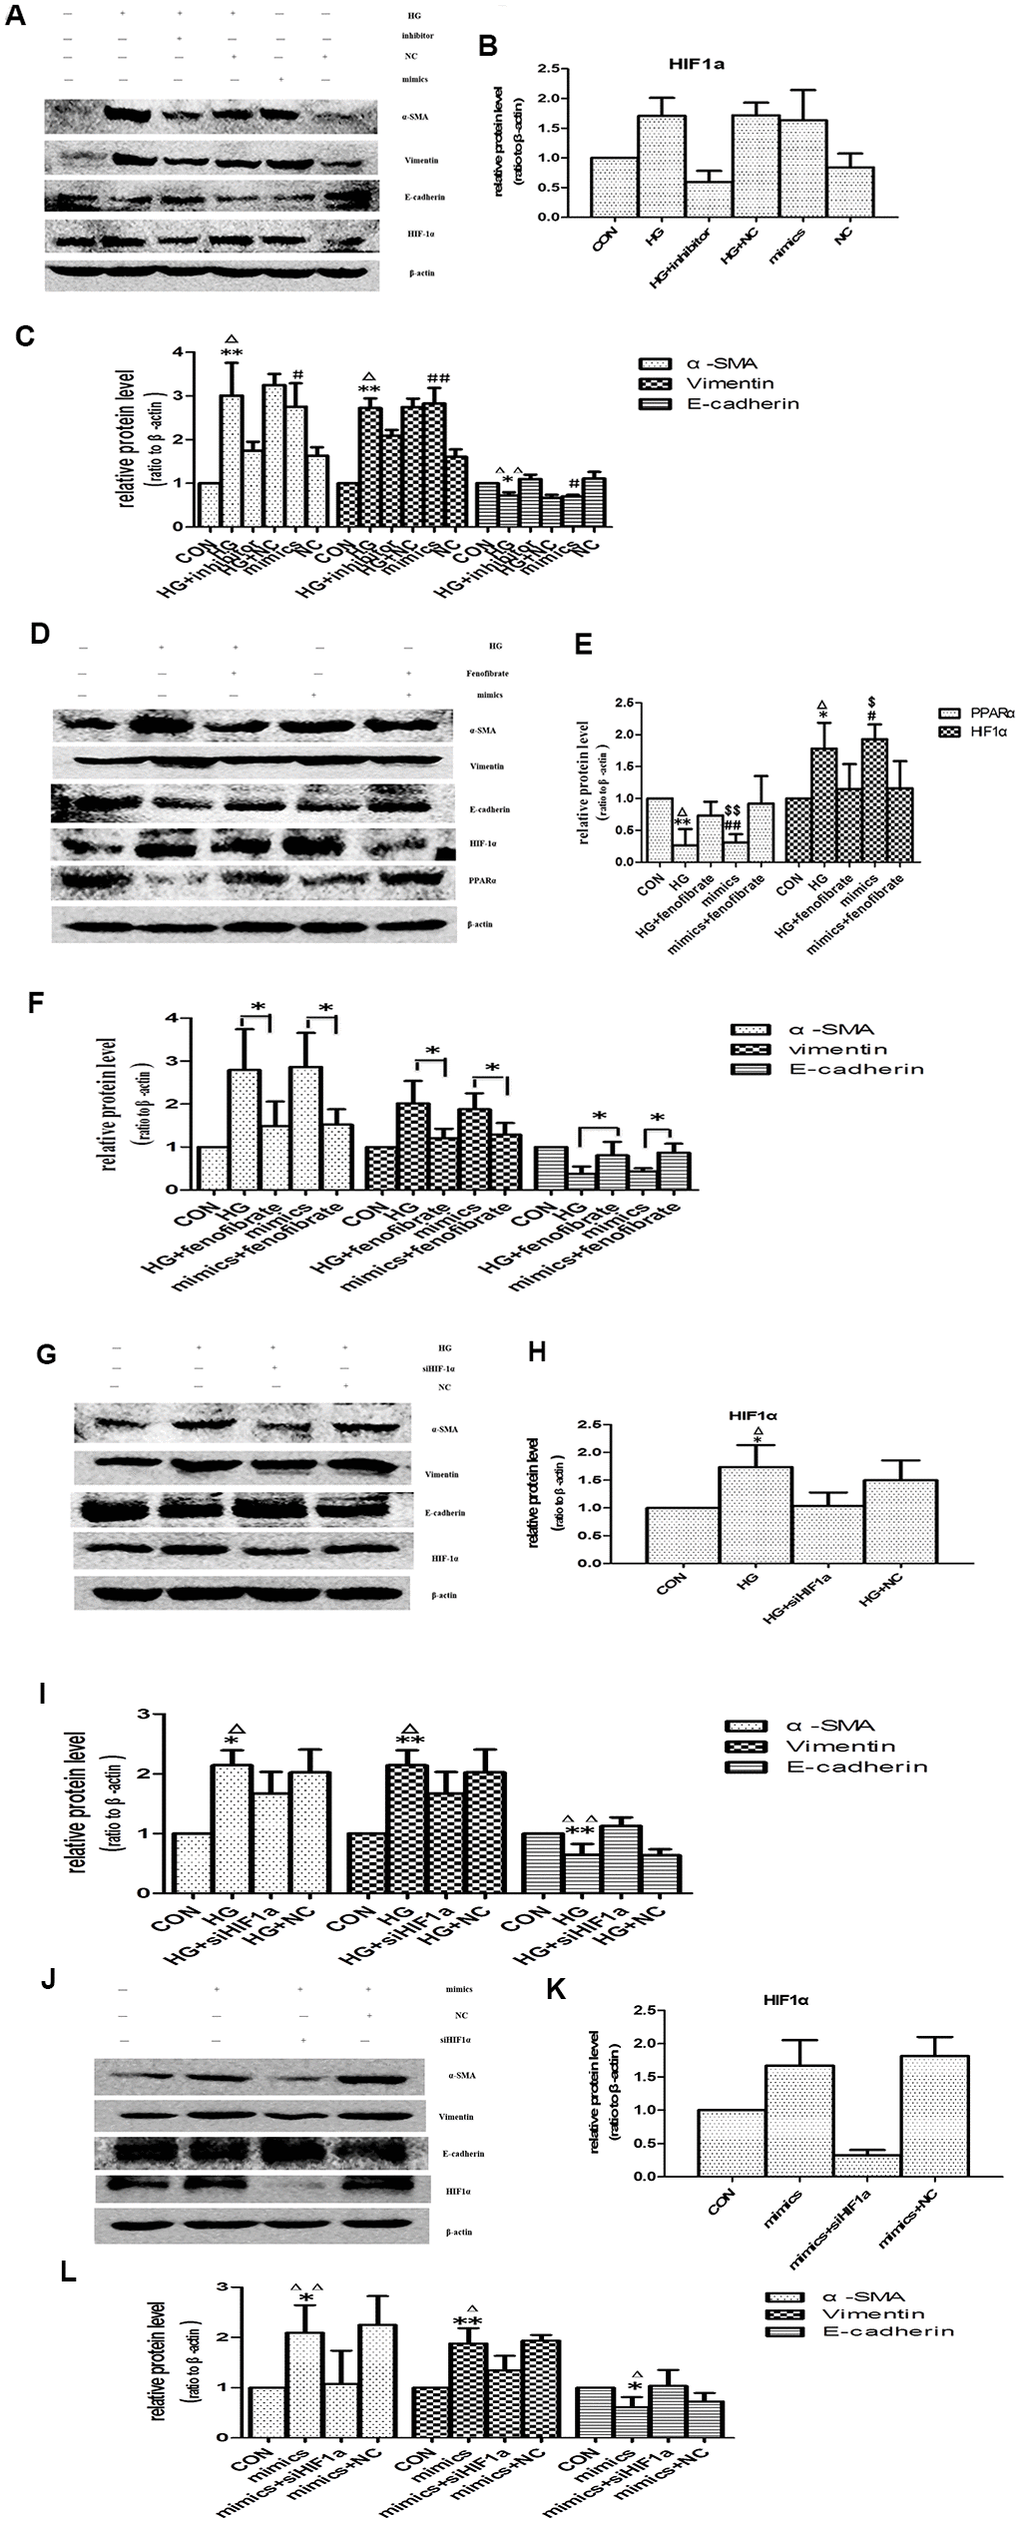
Figure 8.Effects of miR-21 on PPARα/HIF-1α signaling. (A) Cells incubated under normal glucose (CON), high glucose (HG), miR-21 mimics, HG+miR-21 inhibitor, miR negative control (NC), and HG+NC for 48h were harvested for Western blot analysis of EMT marker and HIF-1α signaling. (B, C) Quantitative analysis of band density for E-cadherin, α-SMA, vimentin and HIF-1α. Data are presented as mean ± SD. * p < 0.05 (HG vs CON); Δp < 0.05 (HG vs HG + inhibitor); # p < 0.05 (mimics vs CON); **/ΔΔ/## p<0.01. (D) Cells incubated under CON, HG, miR-21mimics, HG+fenofibrate, miR-21mimics+fenofibrate for 48h were harvested for Western blot analysis of EMT marker and PPARα/HIF-1α signaling. (E, F) Quantitative analysis of band density for E-cadherin, α-SMA, vimentin, PPARα and HIF-1α. Data are presented as mean ± SD. * p < 0.05 (HG vs CON); Δp < 0.05 (HG vs HG+ fenofibrate); # p < 0.05 (mimics vs CON); $ p < 0.05 (mimics vs mimics+ fenofibrate). **/ΔΔ/##/$$ p<0.01. (G) HPTCs treated with CON, HG, HG+ siHIF-1α, and HG+ si-con (NC) for 48 h were harvested for Western blot analysis of EMT marker and HIF-1α signaling. (H, I) Quantitative analysis of band density for E-cadherin, α-SMA, vimentin and HIF-1α. Data are presented as mean ±SD. *p < 0.05 (HG vs CON); Δp < 0.05 (HG vs HG+ siHIF-1α). **/ΔΔp<0.01. (J) HPTCs treated with CON, miR-21mimics, miR-21mimics+siHIF-1α, and miR-21mimics+si-con (NC) for 48 h were harvested for Western blot analysis of EMT marker and HIF-1α signaling. (K, L) Quantitative analysis of band density for E-cadherin, α-SMA, vimentin and HIF-1α. Data are presented as mean ± SD. * p < 0.05 (mimics vs CON); Δp < 0.05 (mimics vs mimics+siHIF-1α). **/ΔΔp<0.01.