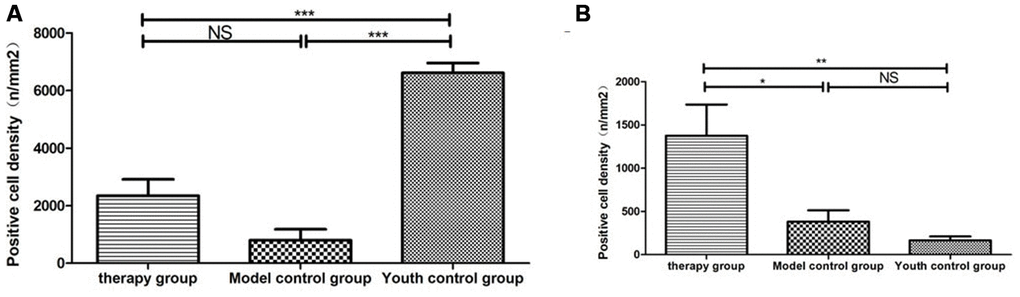
Figure 13.Differential expression of CD4 and CD8 in the thymus between different groups. (A) Thymus CD4 expression after mUCMSC treatment; (B) Thymus CD8 expression after mUCMSC treatment. CD4+ lymphocytes were predominant in the young control group, and CD8+ lymphocytes were rare. Note *** indicates p value <0.001, ** indicates p value <0.01, * indicates p value <0.05, NS indicates p value>0.05.