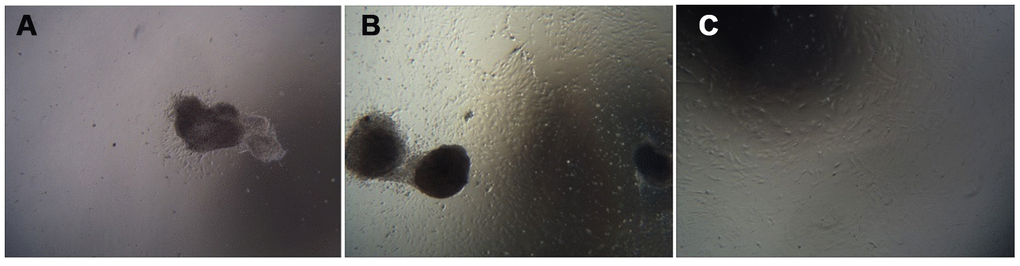
Figure 4.Cell growth morphology (100×). Note: (A) shows the first day of primary culture, as the cells migrate from the umbilical cord tissue. (B) shows the sixth day of primary culture, and the cells that grew were observed around the umbilical cord tissue. (C) is a cell from the P3 generation.