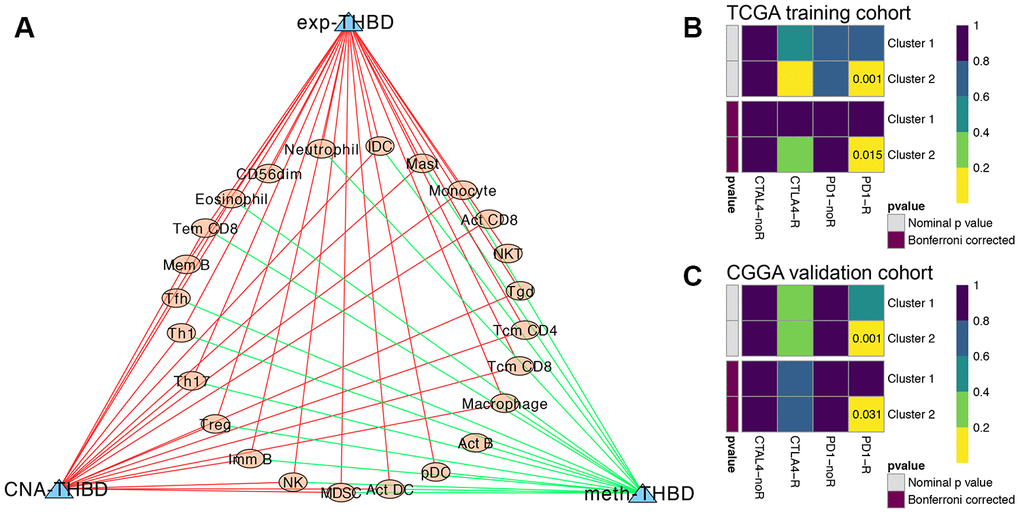
Figure 7.Immune infiltration analysis and immunotherapy response predictions. (A) The regulatory network between TILs and the expression, methylation and CNA of THBD, with |Pearson correlation coefficient| > 0.3, and P < 0.05. Yellow dots represent TILs of GBM, and blue triangles represent THBD. Green/Red lines represent negative/positive correlations between TILs and THBD. Subclass mapping analysis of the TCGA (B) and CGGA (C) GBM patients for predicting the likelihood of clinical response to anti-PD1 and anti-CTLA4 therapy in different clusters based on the novel HRG-based classification. R was short for immunotherapy respondent.