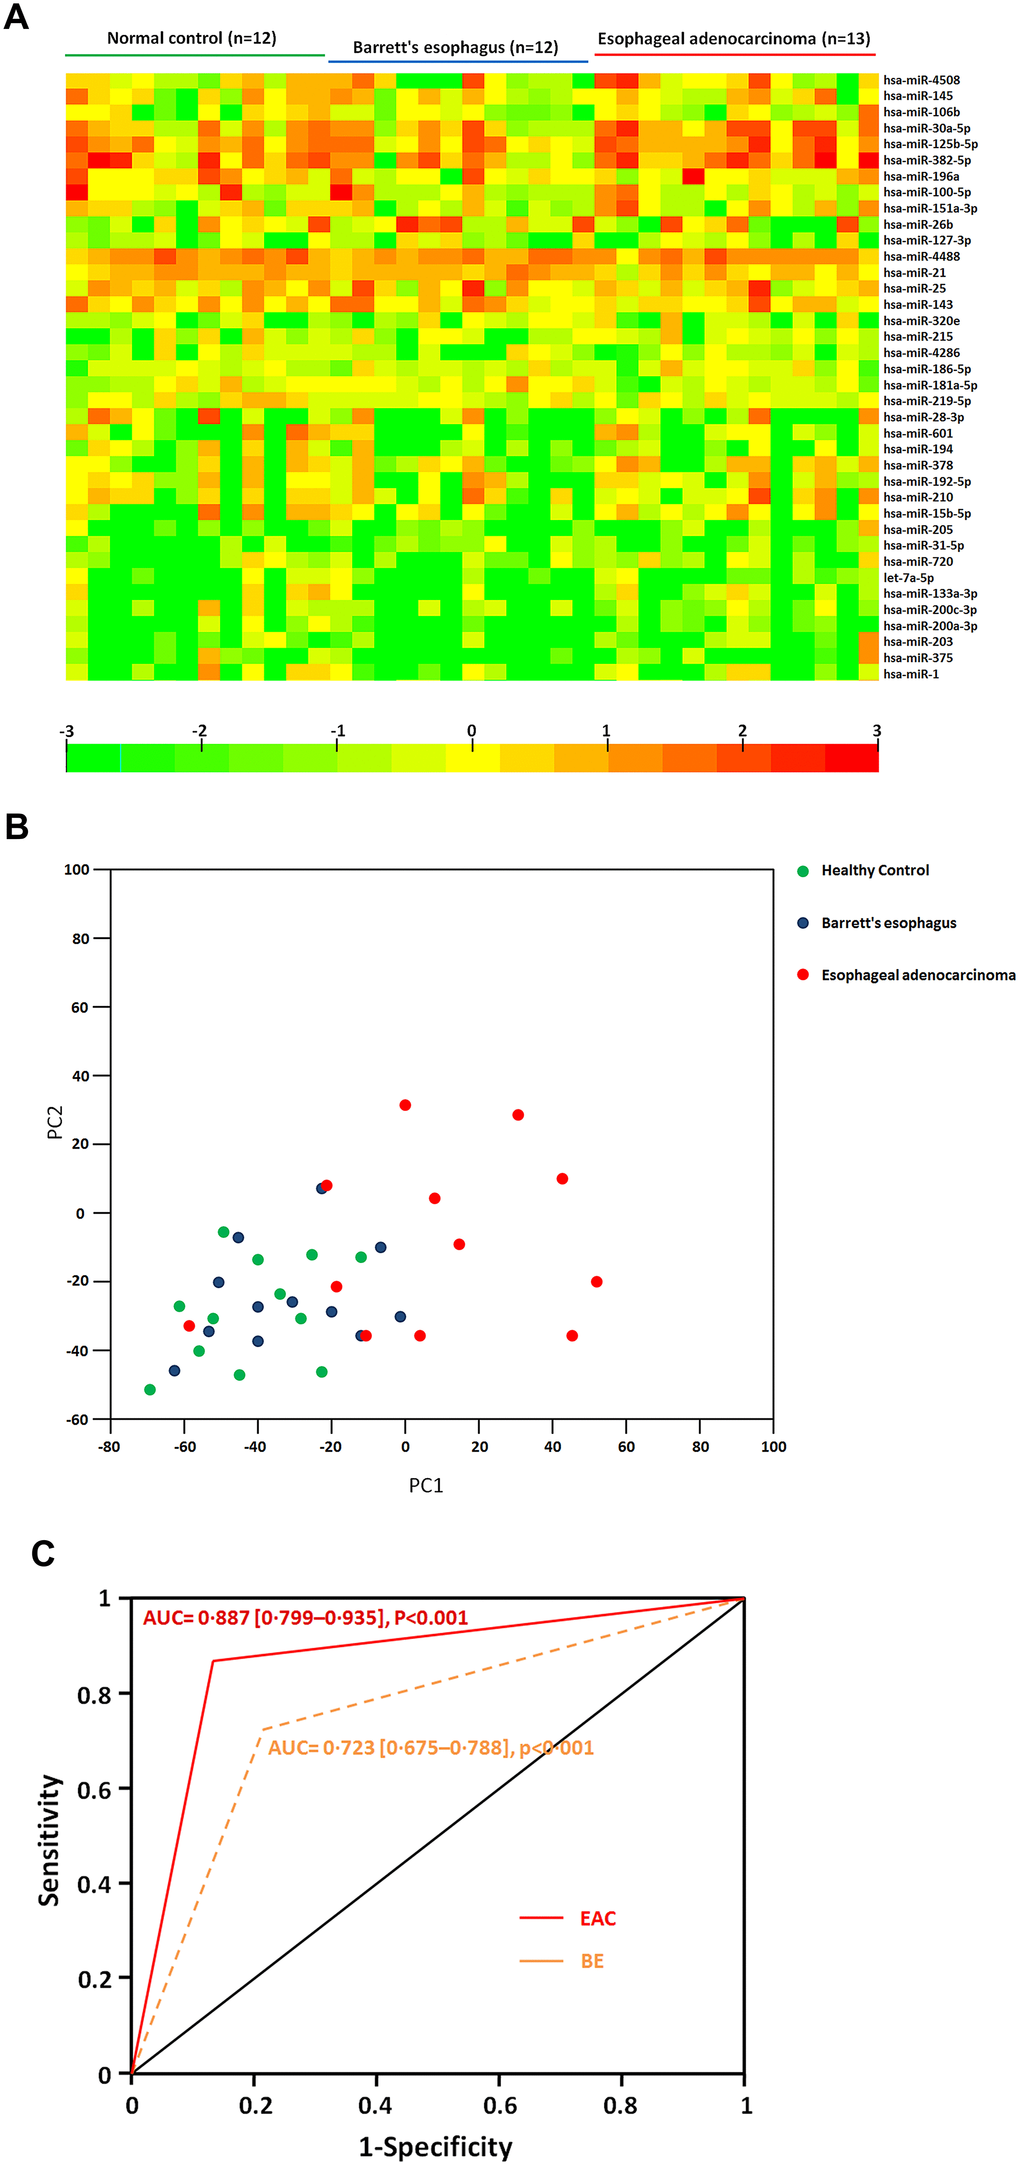
Figure 2.(A) Heatmap of differential sera miRNA profiles during the sequential progression of Barrett’s esophagus to esophageal adenocarcinoma. Heatmap representation of the mean fold change in differential miRNA signature. Two-dimensional grid matrix displaying 38 serum miRNAs was obtained by the functional heat-map in R. Columns refer to time course comparison: 12 healthy controls, 12 BE and 13 EAC. Rows stand for the 38 differential miRNAs. Each entry of the grid refers to relative fold (log2) of a given miRNA. The color of each entry is determined by the value of that fold difference, ranging from green (negative values) to red (positive values). (B) Principal component analysis. The plots for disease phenotypes (12 healthy controls, 12 BE and 13 EAC) were performed as principal component analysis among all samples based on miRNA profiles. (C) The performance of sera exosomal microRNA classifier to detect the risk of BE and EAC. ROC curves from 12 healthy controls, 12 BE and 13 EAC. Performance shown for distinguishing individuals with BE or EAC from healthy controls.