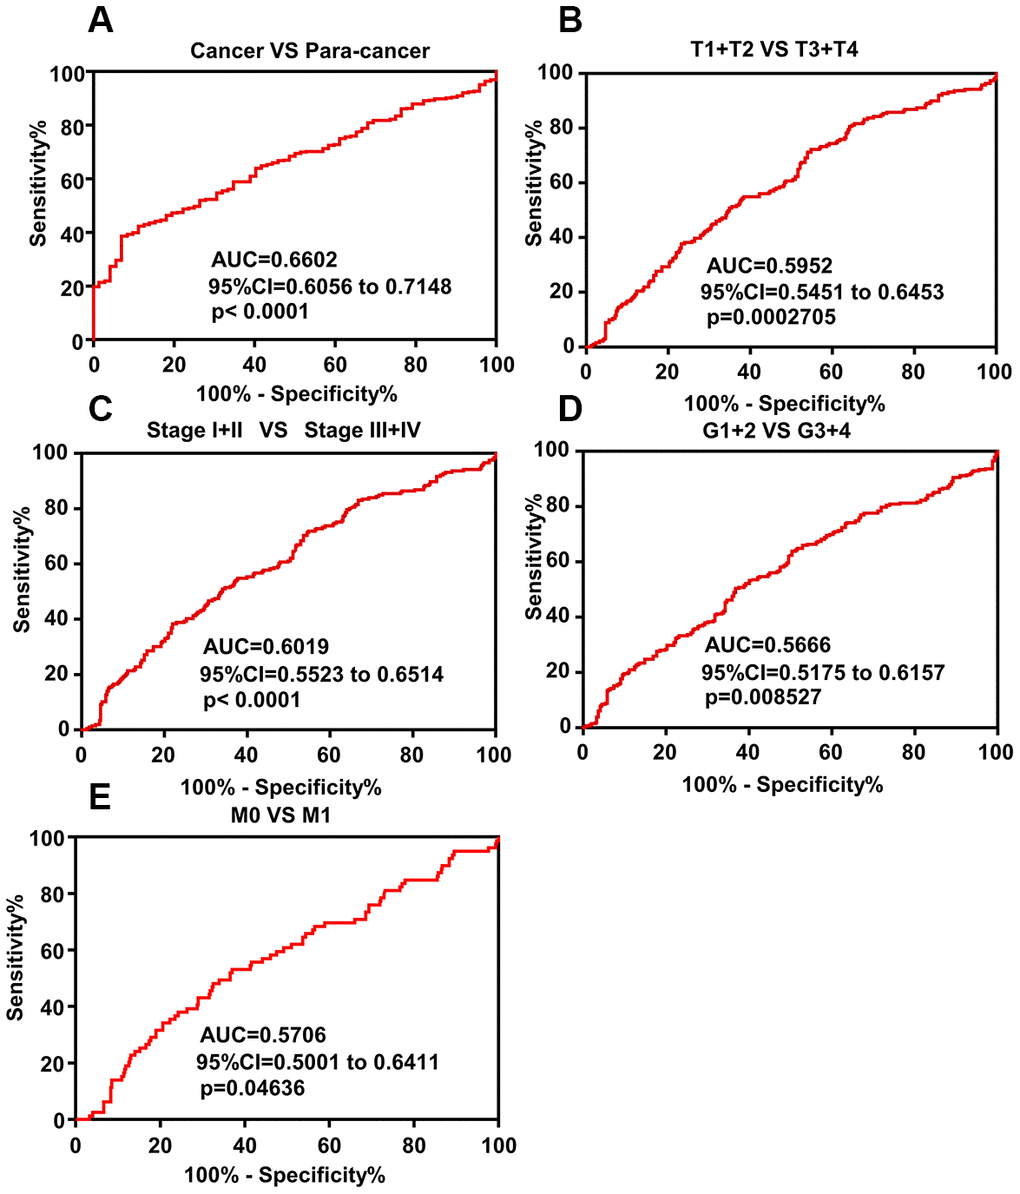
Figure 3.ROC curve analysis shows diagnostic significance of DAPK1 expression in ccRCC patients. (A) ROC curve analysis shows that DAPK1 expression accurately distinguishes ccRCC tissues from the corresponding normal kidney tissues with an AUC value of 0.6602 (95% CI: 0.6056 to 0.7148; p<0.0001). (B–E) ROC curve analysis shows that DAPK1 expression distinguishes advanced- and early-stage ccRCC patients based on (B) T stages (T1+T2 vs. T3+T4), (C) pathologic Stages (I+II vs. III+IV), (D) G stages (G1+G2 vs. G3+G4), and (E) M stages (M0 vs. M1).