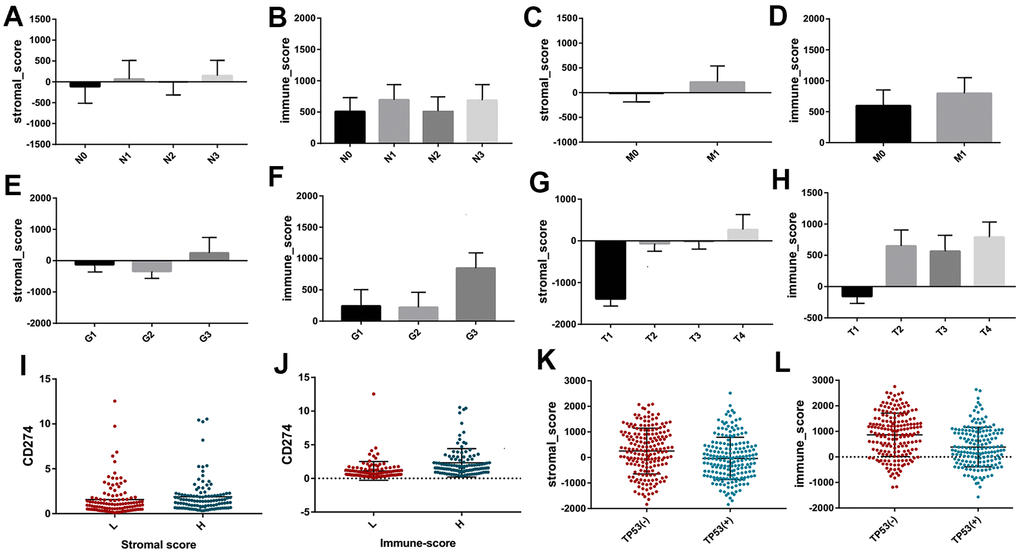
Figure 2.The different distribution of stromal scores and immune scores in different clinicopathological features, including stage N (A, B) stage M (C, D) grade (E, F) and stage T (G, H). The different expression of CD274 between high and low groups based on immune scores and stromal scores (I, J). The different distribution of stromal scores and immune scores between different TP53 mutation and wildtype (K, L).