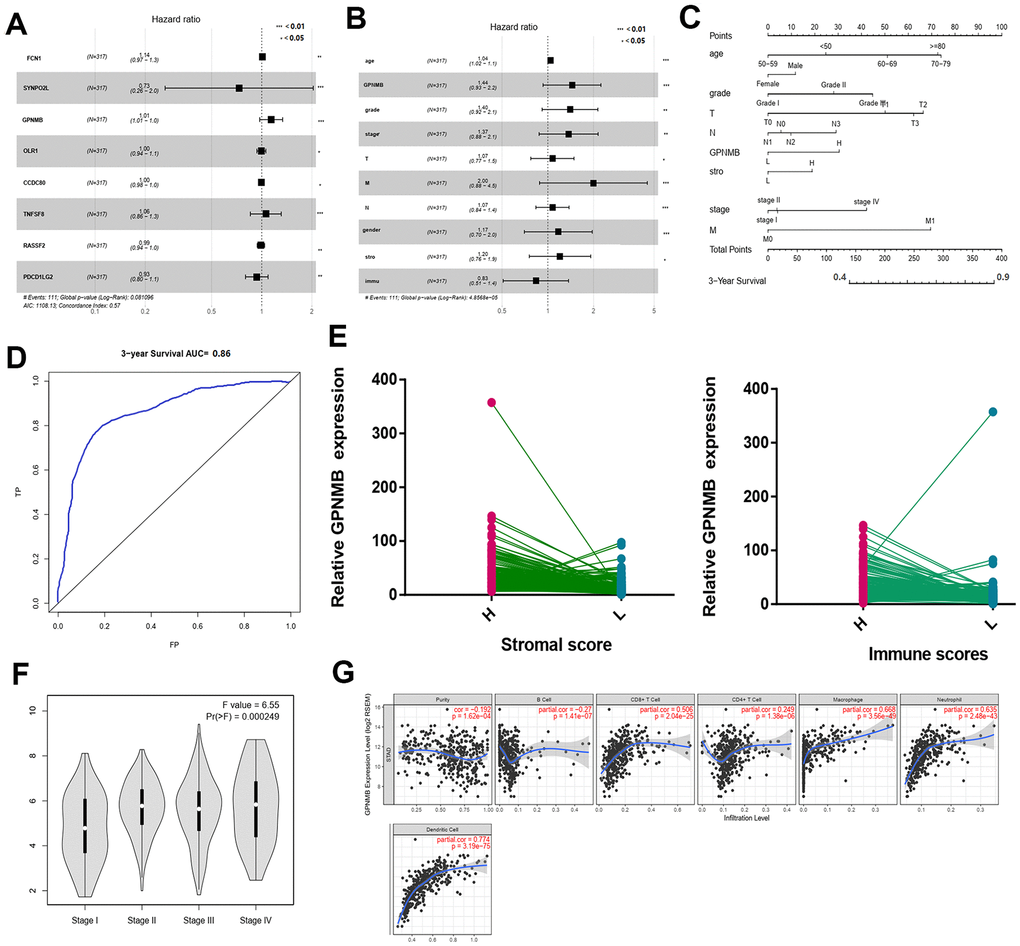
Figure 6.Multivariate Cox regression analyses among the hub genes. (A) and related clinical characteristics respectively (B). The prognostic nomogram that integrated all significant independent factors from the multivariate analysis for OS in the training cohort (C). The RCO curve area evaluating the prognostic nomogram for OS prediction was 0.860 (D). The relate GPNMB expression between high and low immune scores (E). The different expression of GPNMB in STAD with different stage features (F). The correlation of GPNMB expression with immune infiltration level in STAD via TIMER (G).