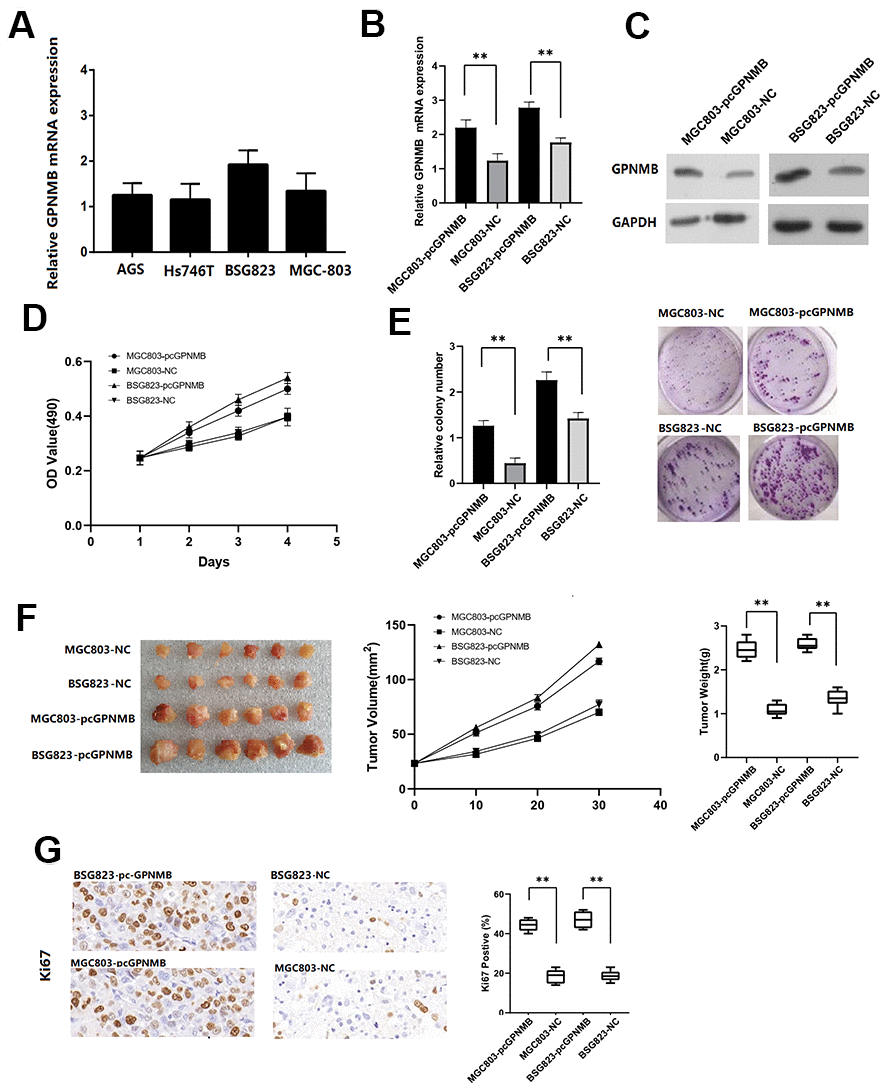
Figure 7.The GPNMB expression in different STAD cells. (A) The expression efficiency of pc-GPNMB was measured by RT-Qpcr (B) and WB assay (C) in MGC803 and BSG823 cells. MTT assays show that GPNMB overexpression increased cell proliferation in MGC803 and BSG823 cells (D). Colony formation assays indicate significantly increased the number of colonies in pc-GPNMB group (MGC803 and BSG823 cells) cells compared to NC group (E). The plots showing tumor growth measurements of MGC803-pc-GPNMB, MGC803 (control), BSG823- pc-GPNMB and BSG823 (control) cells is shown, and the mean tumor weights in each group (MGC803-pc-GPNMB, MGC803, BSG823-pc-GPNMB and BSG823) on day 30 is shown (F). IHC staining showing that cell proliferation (Ki67-positive) positively correlates with GPNMB expression levels (G). All the above experiments were repeated six times respectively. *P < 0.05 versus control.