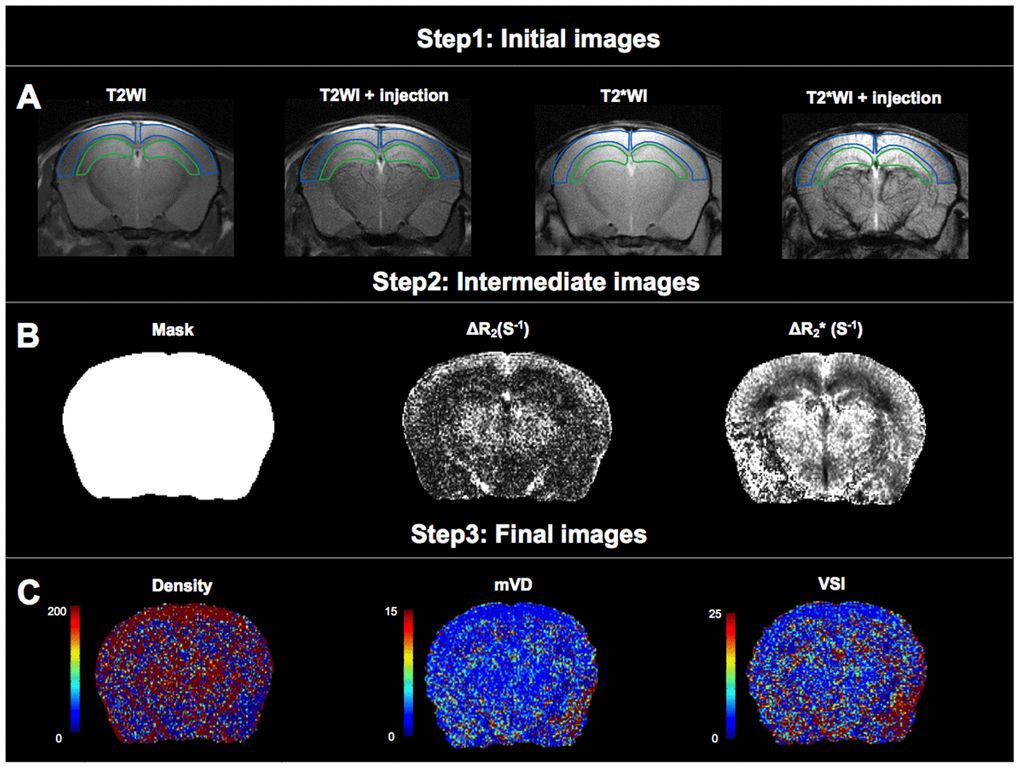
Figure 1.Analysis of microvascular density (Density), mean vessel diameter in the voxel (mVD), and vessel size index (VSI). (A) The first step of data processing. Two regions of interest (ROIs) were delineated on T2WI and projected to other images. The ROI delineated by the blue line is cortical region, and the ROI delineated by the green line is hippocampal region. (B) The second step of data processing. Maps of mask, ΔR2 and obtained from intermediate steps of data processing. (C) The third step of data processing. Colormaps of Density, mVD and VSI of obtained images.