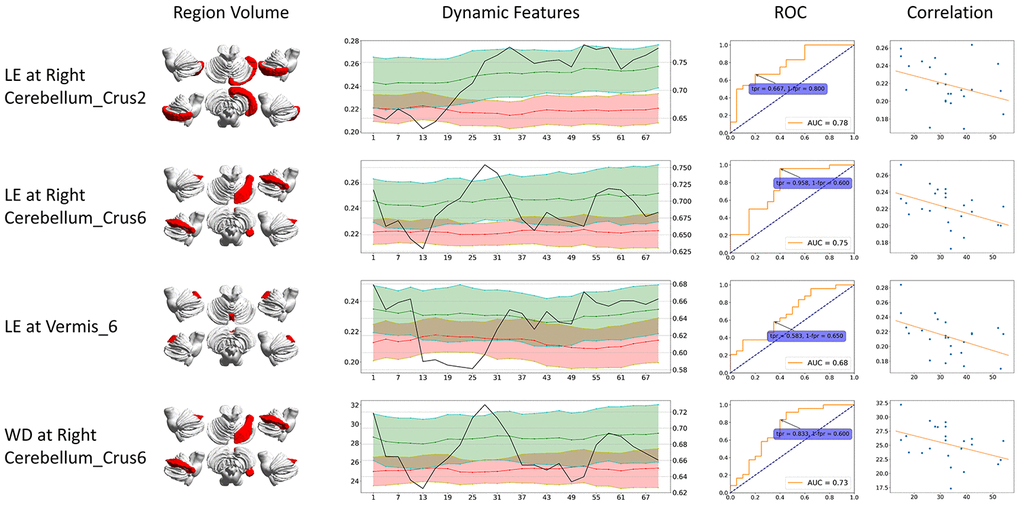
Figure 2.Dynamic graph attributes curves with ROC AUC plots, ROC curve at the maximum ROC AUC time point, and correlation of features and clinical scores. For Dynamic Features line plots, black line stands for ROC AUC (value on the right axis). Green stands for healthy controls and red stands for CMSA patients (value on the left axis). The ROC curve at the time point when AUC reached its maximum is shown. The correlation is between clinical score (x-axis) and features (y-axis). BC: betweenness centrality; CCFS: clustering coefficient; LE: local efficiency; WD: weighted degree.