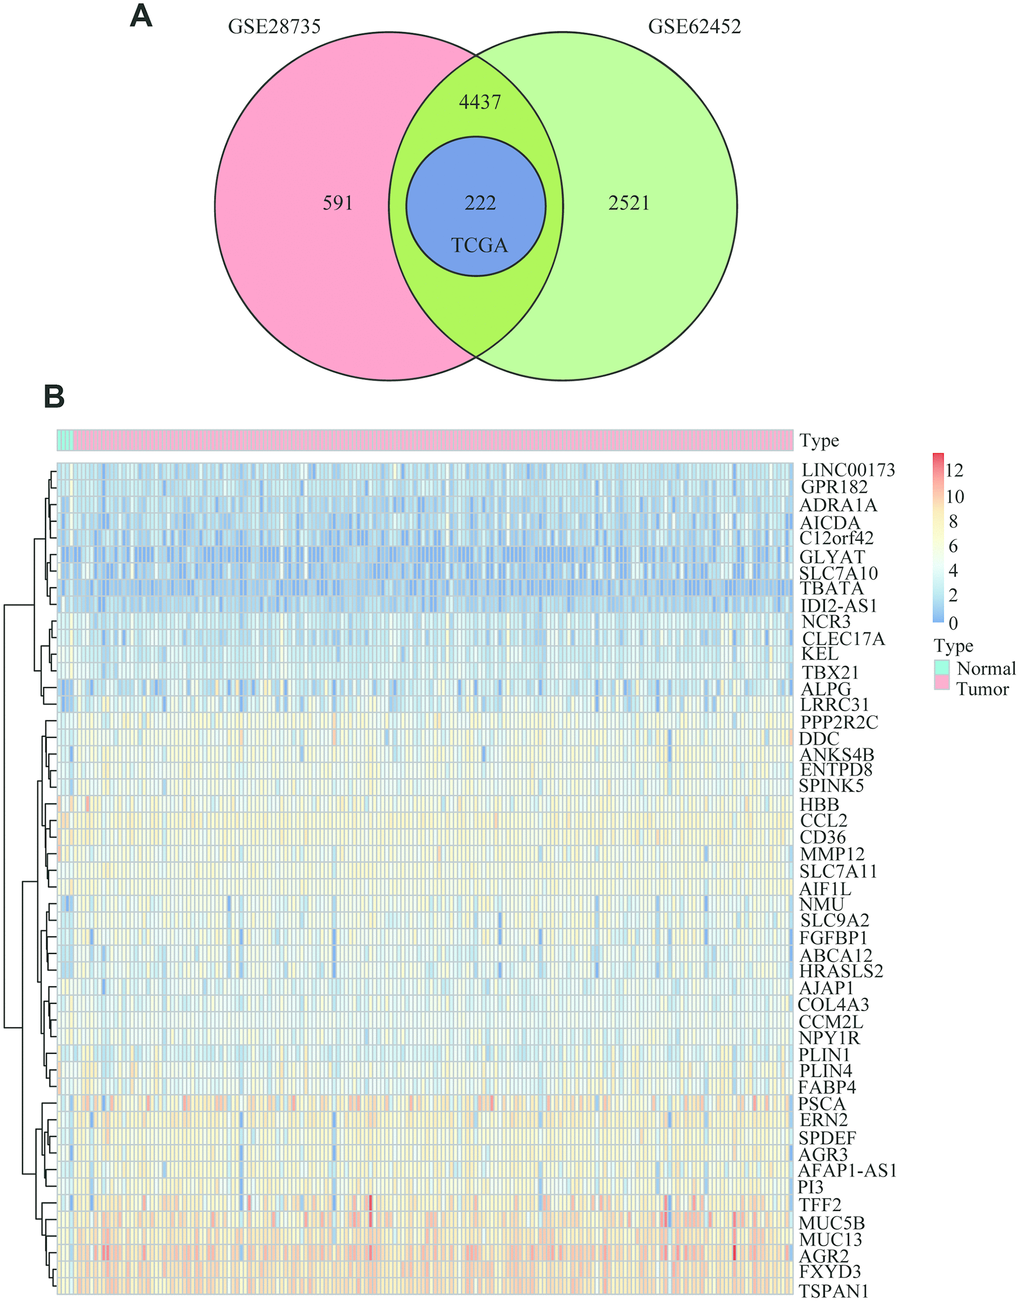
Figure 2.Common differentially expressed genes between PC and normal tissues. (A) Venn diagram showing the common DEGs in PC and adjacent normal tissues from the GSE28735, GSE62452 and TCGA datasets. (B) Heatmap analysis of the 222 DEGs, which contained the 50 highest expressed genes and the 50 the lowest expressed genes according to the log2FC between normal tissues and cancer tissues from the TCGA datasets.