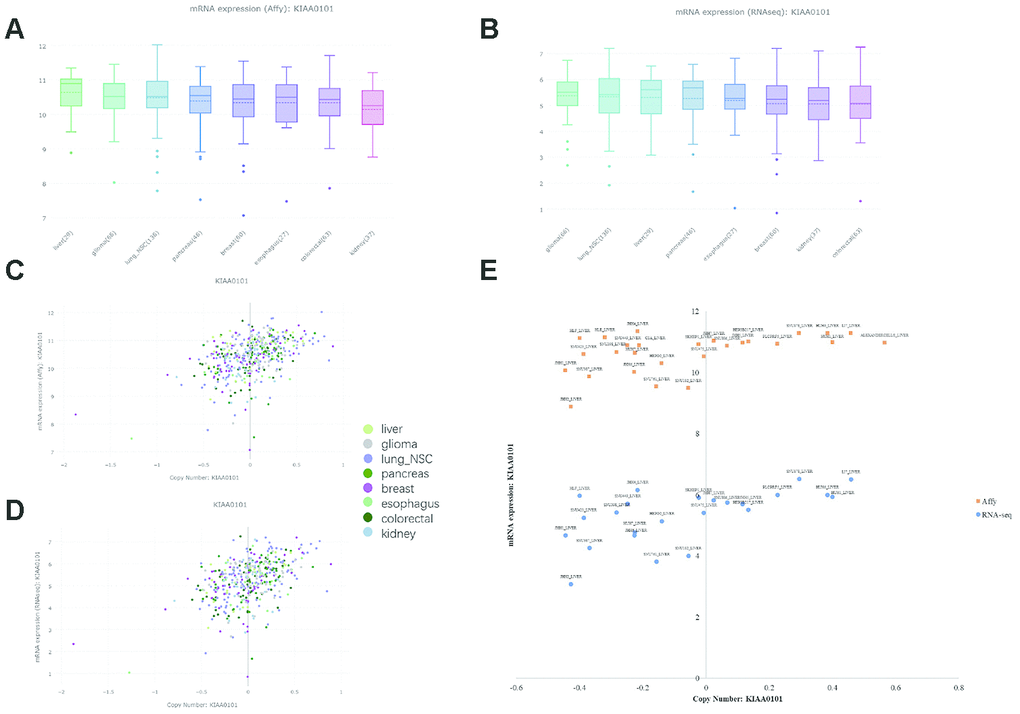
Figure 1.KIAA0101 mRNA expression and copy number in the CCLE database. In the box plots, the solid line indicates the median value, and the dashed line indicates the mean value. (A) KIAA0101 mRNA expression (Affy) levels in liver cancer, glioma, lung nonsmall-cell cancer, pancreatic cancer, breast cancer, esophageal cancer, colorectal cancer, and kidney cancer. The highest KIAA0101 expression was observed in liver cancer. (B) KIAA0101 mRNA expression (RNA-seq) level in these cancer cell lines. (C) The scatter plot demonstrating KIAA0101 mRNA expression (Affy) level and KIAA0101 copy number of cancer cell lines, including liver cancer, glioma, lung nonsmall-cell cancer, pancreatic cancer, breast cancer, esophageal cancer, colorectal cancer, and kidney cancer. (D) The scatter plot demonstrating KIAA0101 mRNA expression (RNA-seq) level and KIAA0101 copy number of these cancer cell lines. (E) The scatter plot demonstrating the KIAA0101 mRNA expression level and KIAA0101 copy number of different cancer cell lines. Orange squares indicate mRNA levels quantified by Affymetrix; blue circles indicate mRNA expression profiled by RNA-seq. The names of these liver cancer cell lines are annotated, including ALEXANDERCELLS_LIVER, C3A_LIVER, HEP3B217_LIVER, HEPG2_LIVER, HLE_LIVER, HLF_LIVER, HUH1_LIVER, HUH6_LIVER, HUH7_LIVER, JHH1_LIVER, JHH2_LIVER, JHH4_LIVER, JHH5_LIVER, JHH6_LIVER, JHH7_LIVER, LI7_LIVER, NCIH684_LIVER, PLCPRF5_LIVER, SKHEP1_LIVER, SNU182_LIVER, SNU387_LIVER, SNU398_LIVER, SNU423_LIVER, SNU449_LIVER, SNU475_LIVER, SNU761_LIVER, SNU878_LIVER and SNU886_LIVER.