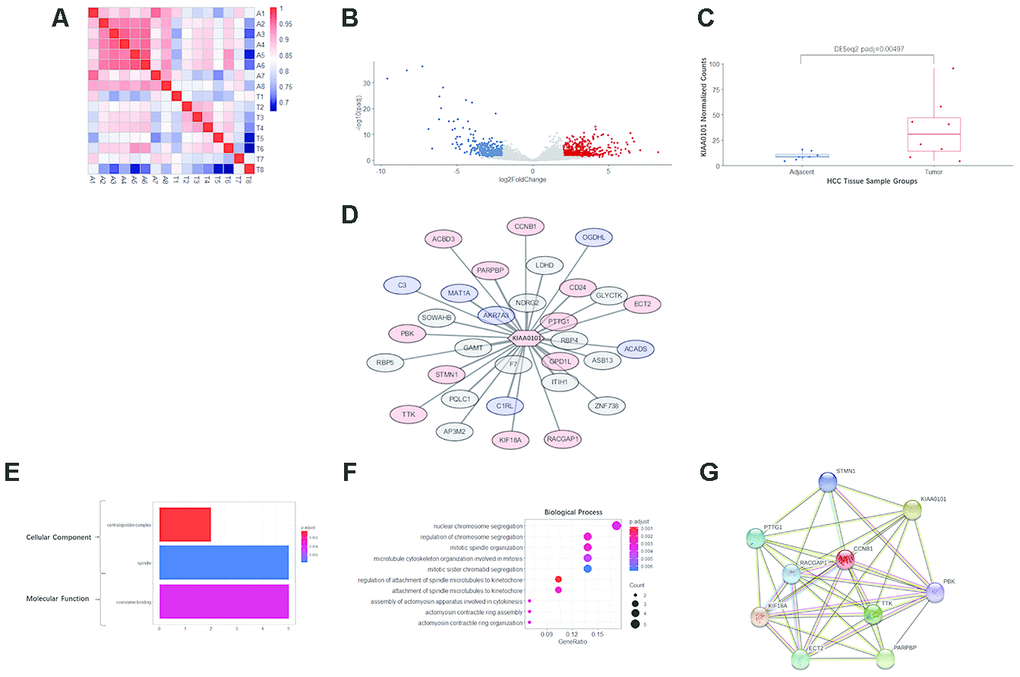
Figure 5.RNA sequencing, differential analysis, transcriptomic coexpression, and functional analysis of our HCC specimens. (A) Heatmap demonstrating the correlation between the 8 pairs of adjacent and tumor samples. A1-A8 are adjacent tissues; T1-T8 are tumor tissues. The more intense red indicates a higher correlation, and the more intense blue indicates the opposite. (B) The volcano plot showing the distribution of differentially expressed genes in KIAA0101. The log2FoldChange and adjusted p-value (padj) were calculated by R package DESeq2. Red dots indicate significantly upregulated genes (padj<0.05, long2FoldChange>2), and blue dots indicate significantly downregulated genes (padj<0.05, long2FoldChange< -2). (C) KIAA0101 mRNA expression levels in 8 pairs of HCC tumor and adjacent tissue samples. The normalized counts and adjusted p-value (padj) = 0.00497 were calculated by R package DESeq2. The boxplot demonstrates the normalized counts in individual samples (scattered dots), average normalized counts (midline of the box), upper quartile (upper edge of the box), and lower quartile (lower edge of the box). (D) The WGCNA correlation network including KIAA0101 and the top 31 coexpressing genes (weight>0.01). The red nodes represent 13 genes that are significantly upregulated (padj<0.05), and the blue nodes represent 6 significantly downregulated genes (padj<0.05). The length of edges connecting the nodes is in reverse proportion to the weighted correlation. (E) The results of GO analysis (cellular component and molecular function) of the top 31 coexpressing genes are shown in Figure 5F. The more intense red indicates higher significance, and the more intense blue indicates the opposite. The horizontal axis indicates the count of a specific term in the result of GO analysis. (F) GO analysis (biological process) of the top 31 coexpressing genes. The more intense red indicates a lower adjusted p-value and higher significance, and the more intense blue indicates the opposite. The horizontal axis indicates the ratio of a specific term count to the total count of terms. The size of the dot indicates the count of a specific term. (G) The STRING protein-protein interaction network involving 10 genes from the KIAA0101 coexpression network. The nodes represent the proteins encoded by the specific genes. Sky-blue edges: known interactions indexed by curated databases. Pink edges: experimentally determined known interactions. Green edges: predicted interactions based on gene neighborhoods. Black edges: coexpression relationships.
Figure 5 — Prognostic value and underlying mechanism of KIAA0101 in hepatocellular carcinoma: database mining and co-expression analysis | Aging