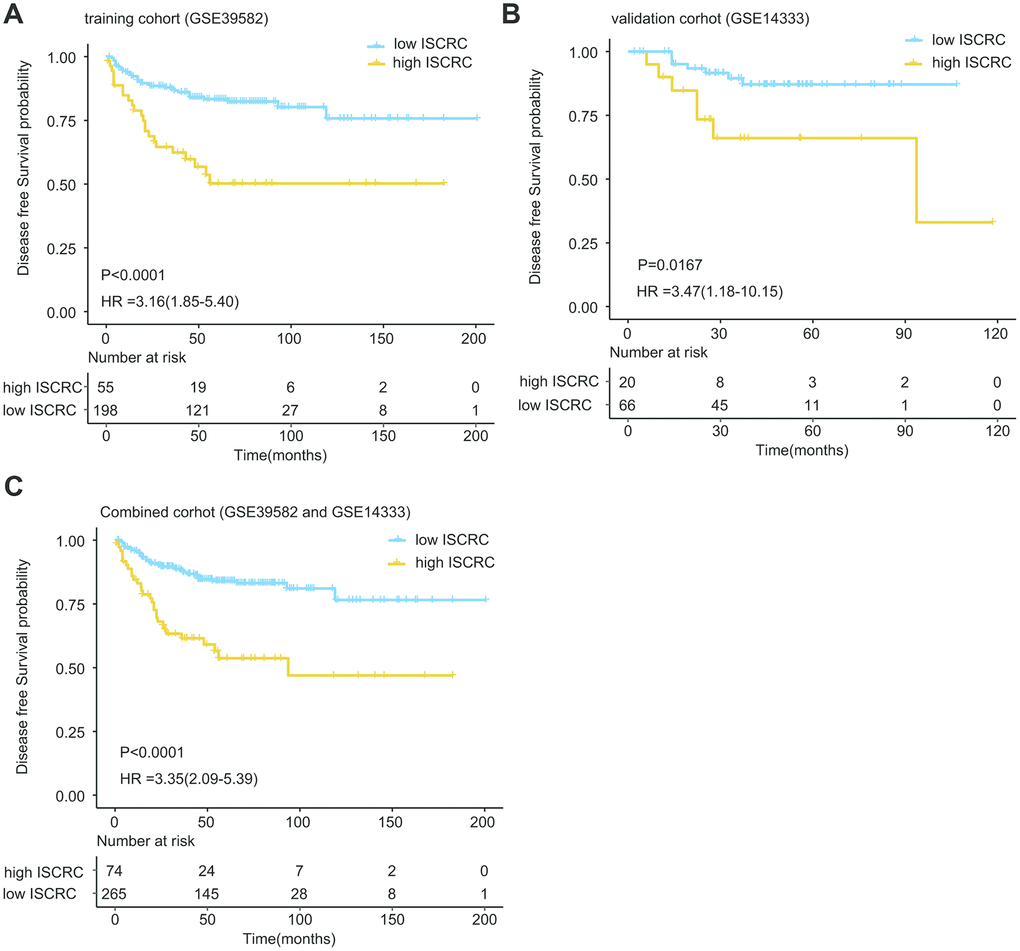
Figure 1.Kaplan-Meier estimates of the patients’ DFS using the ISCRC model. The Kaplan-Meier plots were used to visualize the patients’ recurrence probabilities for the low-ISCRC versus high-ISCRC group of patients from corresponding GEO datasets. (A) Kaplan-Meier curves for training dataset GSE39582 (N=253); (B) Kaplan-Meier curves for GSE14333 (N=86); (C) Kaplan-Meier curves for combined dataset (GSE39582 and GSE14333) (N=339). The tick marks on the Kaplan-Meier curves represent the censored subjects. The differences between the two curves were determined by the two-side log-rank test.