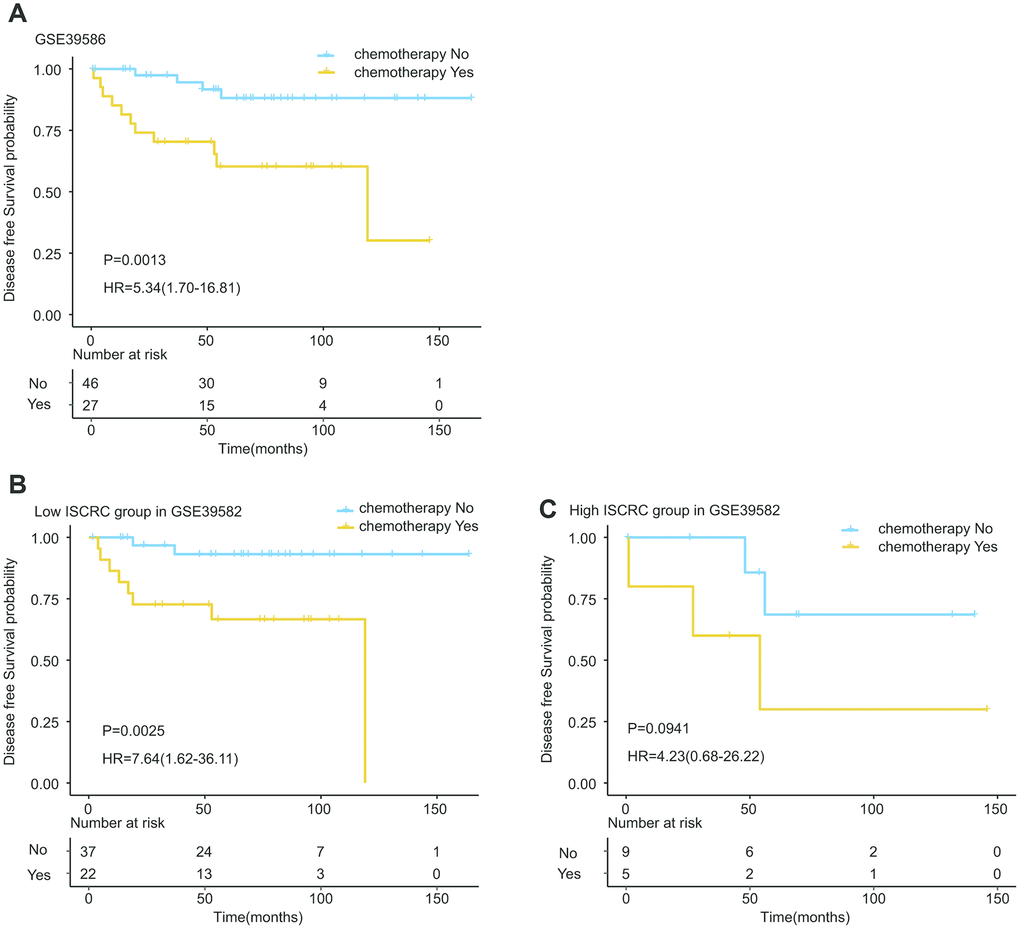
Figure 4.Kaplan-Meier estimates of the effect of adjuvant chemotherapy on patients’ DFS. To eliminate the selection bias, propensity score matching analysis was performed between chemotherapy and non-chemotherapy groups. The Kaplan-Meier plots were used to visualize the patients’ recurrence probabilities for chemotherapy versus non-chemotherapy group of patients in GSE39582. (A) Kaplan-Meier curves for total GSE39582 dataset (N=73); (B) Kaplan-Meier curves for low ISCRC patients in GSE39582 (N=59); (C) Kaplan-Meier curves for high ISCRC patients in GSE39582 (N=14). The tick marks on the Kaplan-Meier curves represent the censored subjects. The differences between the two curves were determined by the two-side log-rank test.