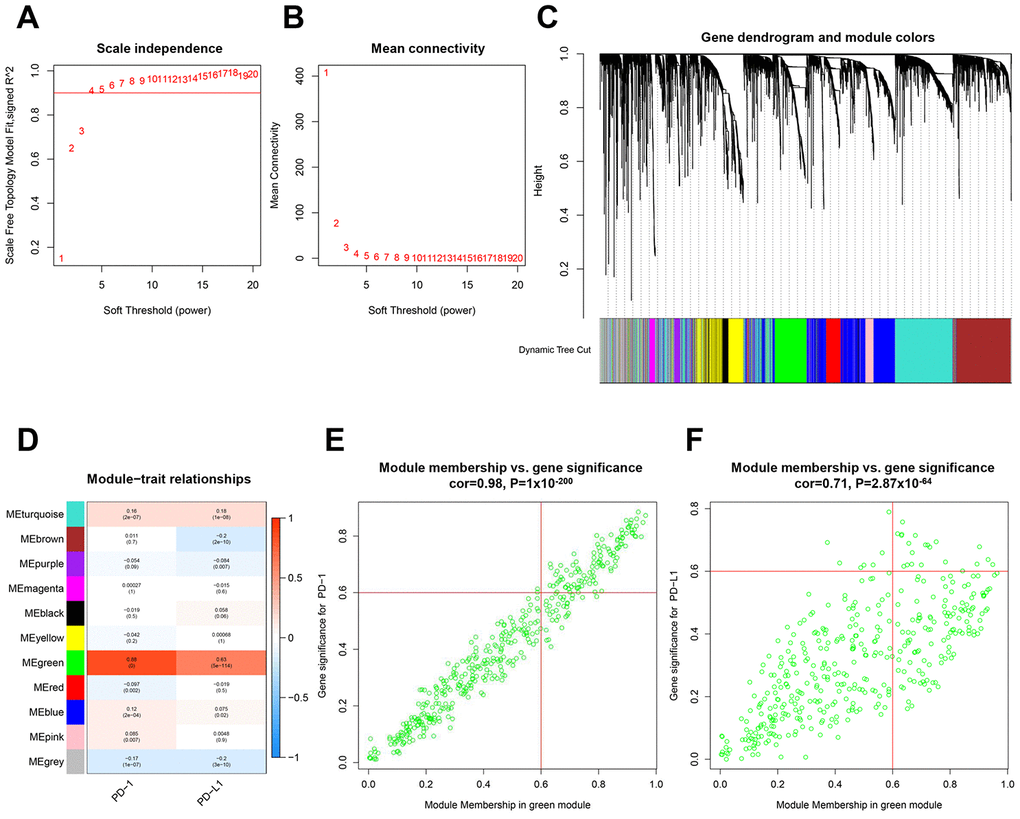
Figure 1.Identification of hub gene clusters that expressed with PD-1 or PD-L1 by WGCNA. (A) Plots visualize the scale-free topology fitting index. (B) The mean connection in different soft thresholds. (C) Branches of the hierarchical clustering dendrogram correspond to gene modules. (D) Heatmap of correlation between modules, eigengenes, and PD-1/PD-L1. Scatter plots visualize correlation between module membership in the Megreen module and gene signification for PD-1 (E) and PD-L1 (F). WGCNA, weighted gene co-expression network.