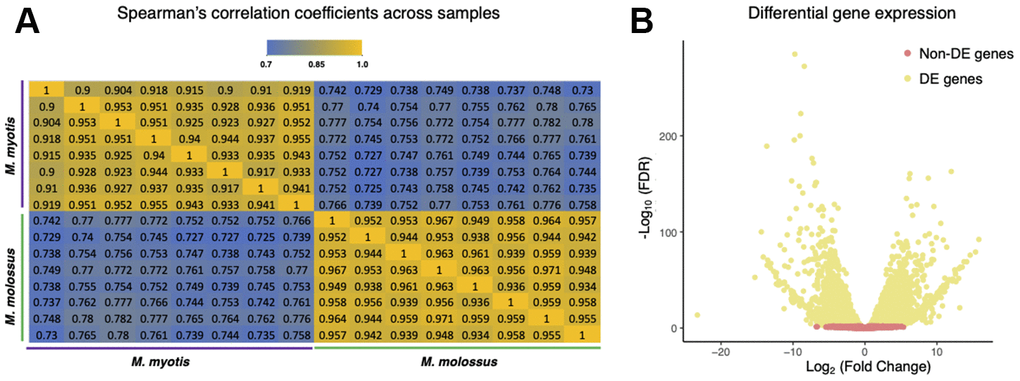
Figure 2.Comparisons of M. myotis and M. molossus blood transcriptomes. (A) Spearman’s correlation coefficients between M. myotis and M. molossus blood transcriptomes based on expression levels of 10,635 single-copy genes. We excluded 1,832 genes that were neither expressed in M. myotis nor M. molossus. (B) Differential gene expression analysis between M. myotis and M. molossus blood transcriptomes. Genes with FDR < 0.05 were considered differentially expressed genes (DEGs).