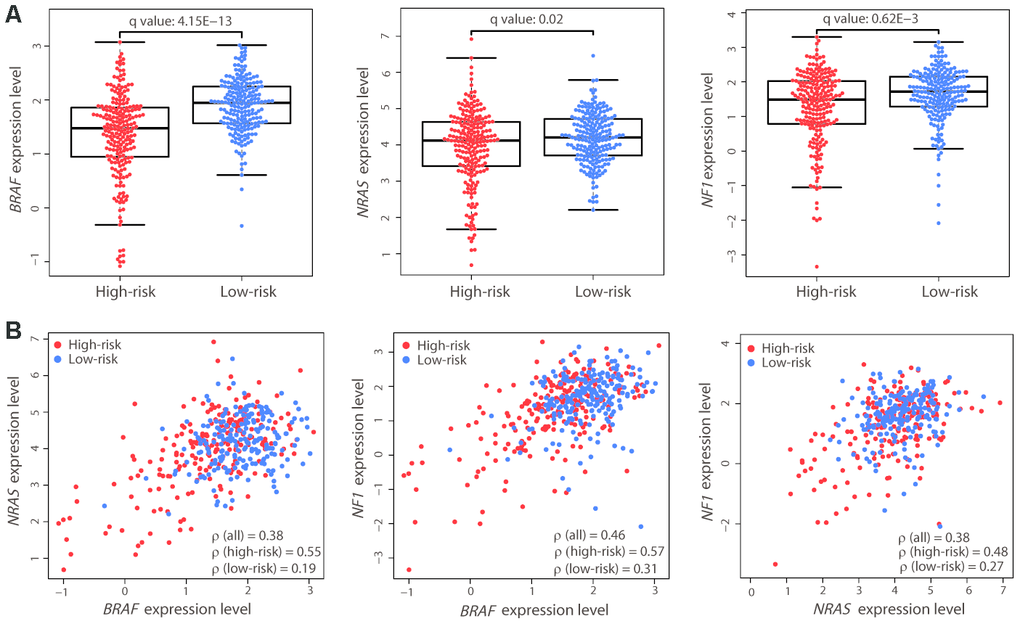
Figure 4.Expression differences and correlation of the three driver genes between the two risk groups. (A) Distribution of the expression levels of BRAF, NRAS, and NF1 in the two risk groups. The expression levels are represented by log2-transformed RPKM values. The P value was calculated by a two-sided Student’s t test and adjusted using the Benjamini−Hochberg method (q value). (B) Correlation between the expression levels of the three driver genes. Each dot represents one patient (high-risk, red dot; low-risk, blue dot). The correlation coefficient ρ was calculated by Spearman’s rank analysis. Coefficient values between two genes among all patients, high-risk patients, and low-risk patients are shown.