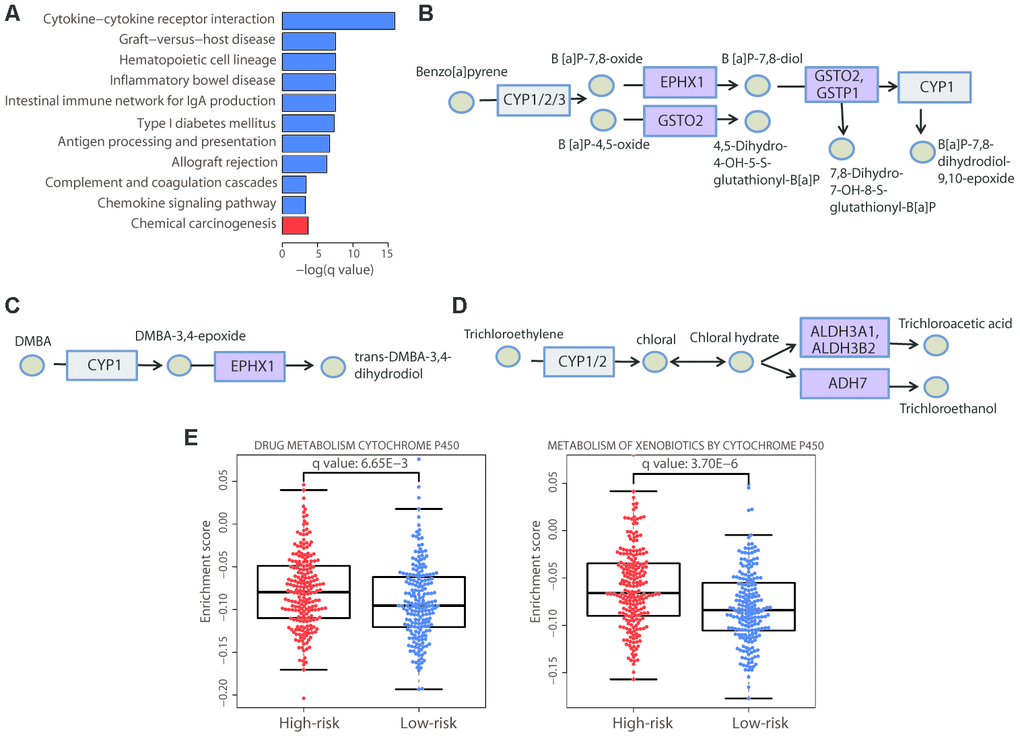
Figure 6.Enrichment of the cytochrome P450-mediated metabolic pathways in the high-risk group. (A) Bar plot showing the significantly (adjusted P value < 0.05) enriched KEGG pathways in the high-risk (red) and low-risk (blue) patients. The chemical carcinogenesis function was significantly enriched in high-risk patients. The specific chemical metabolic pathways are illustrated in (B−D); in these three pathways, each circle represents one chemical compound and each rectangle represents an enzyme. The cytochrome P450 enzymes are marked in gray and the enzymes with altered gene expression are marked in purple. (E) Distribution of the enrichment scores of the cytochrome P450-mediated pathways that showed significant differences (adjusted P value < 0.01) between the two risk groups. Each dot represents one patient. The enrichment score of each patient was calculated by ssGSEA. The P value was calculated by a two-sided Student’s t test and adjusted using the Benjamini−Hochberg method.