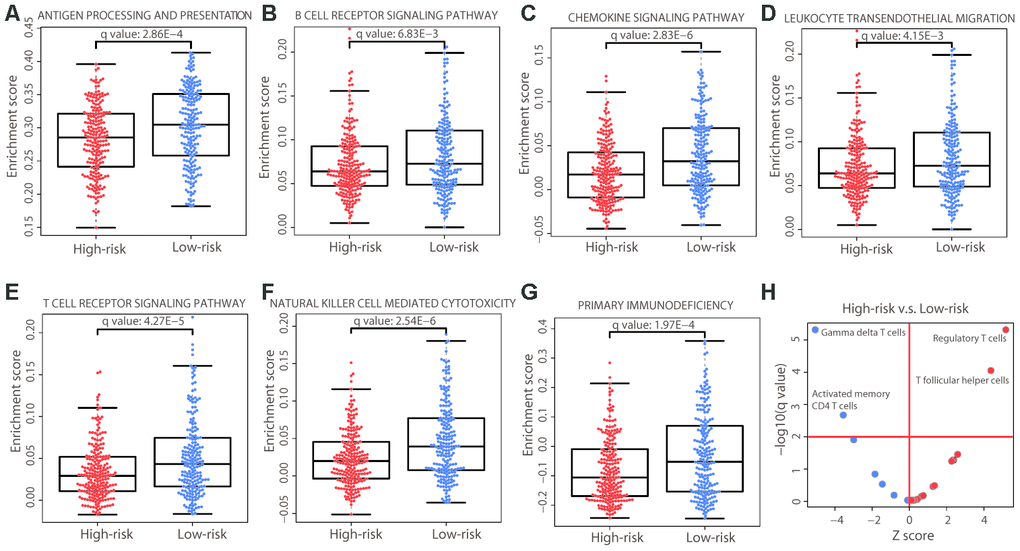
Figure 7.Immune differences between the two risk groups. (A−G) Distribution of the enrichment scores of the immune pathways that were significantly different (adjusted P value < 0.01) between the two risk groups. Each dot represents one patient. The enrichment score of each patient was calculated by ssGSEA. The P value was calculated by a two-sided Student’s t test and adjusted using the Benjamini−Hochberg method. (H) Immune cell composition differences between the high- and low-risk groups. The P values were calculated by the Wilcoxon rank-sum test and adjusted using the Benjamini−Hochberg method. The red horizontal line represents an adjusted P value of 0.01 and the red vertical line indicates a Z score of 0. The analysis was performed for all 22 immune cell types but only those that were significant are labeled on the plot.