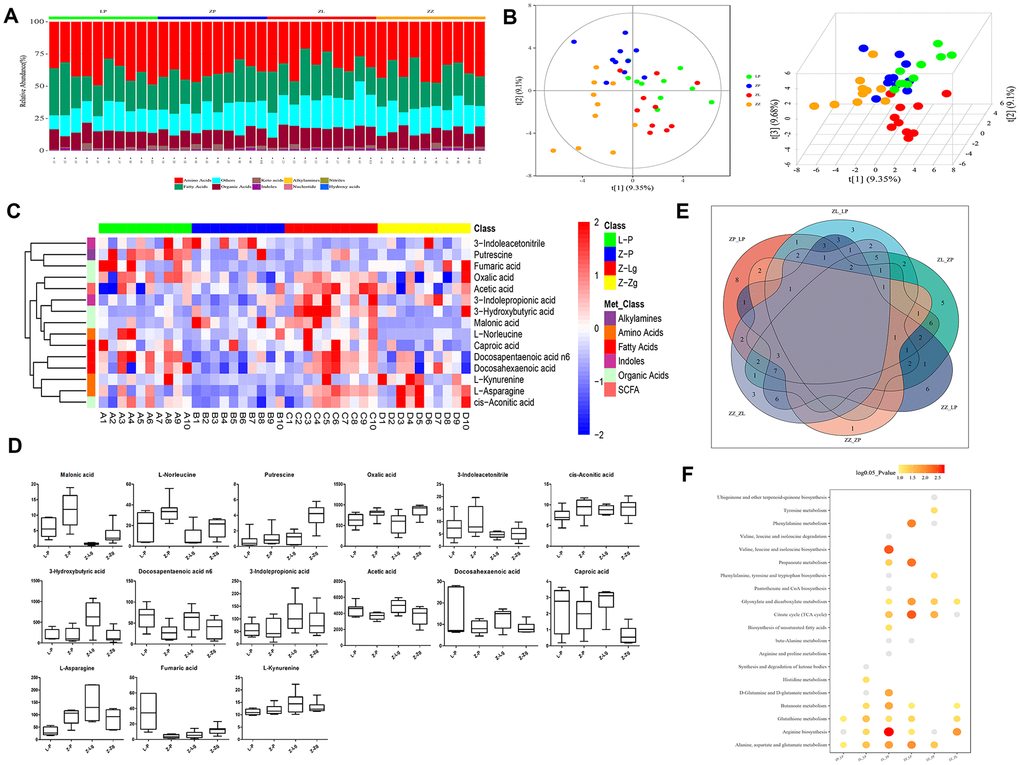
Figure 5.Metabolite composition of intestinal microbiota in ZDF rats after FMT. (A) The composition of metabolite types in each sample; (B) Score plot of 2D and 3D PLS-DA (n = 10). The green dots indicated L-P, the blue dots indicated Z-P, the red dots indicated Z-Lg, and the orange dots indicated Z-Zg; (C) Z-score heat map of differential metabolites. In the figure, the horizontal direction represented samples, and the longitudinal direction represents metabolites. The intensity of the colors represented the degree of association (red, higher content in the corresponding samples; blue, content in the corresponding samples. The relative numerical values represented by the colors were shown in the ribbon on the right.); (D) According to the results of single-dimensional statistics, the P-value was statistically significant for 15 groups of different metabolites as shown in box plots (n = 7-10); (E) Venn diagram of different metabolites. The number of shared and unique different metabolites screened by each group was shown; (F) Bubble map of the P-value of the metabolic pathway involved in the different metabolites. When the bubble was larger or the color was darker, the corresponding P value was smaller. Gray bubble, 0.05 < P < 0.1, Colored bubble, P < 0.05.